Download

1 / 34
340 likes | 479 Views
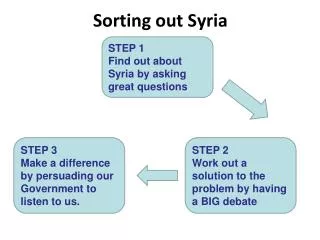
Sorting Out the Outlook for Construction and Materials. Transportation Estimators Assn., St. Louis Prepared October 3, 2007 Ken Simonson Chief Economist Associated General Contractors of America simonsonk@agc.org. Current economic influences. Moderate real GDP growth (2-3%)

E N D
Sorting Out the Outlook for Construction and Materials Transportation Estimators Assn., St. Louis Prepared October 3, 2007 Ken Simonson Chief Economist Associated General Contractors of America simonsonk@agc.org
Current economic influences • Moderate real GDP growth (2-3%) • Low inflation (CPI change 1.5-2.5%) • Moderate job growth, low unemployment (avg. 150,000 jobs/mo., 4.6% unem rate) • Rising real wages, personal income (2%) • Worries about housing, credit, falling dollar
The shifting construction market Segment20068/07 Total (tril. $, SAAR) $1.19 $1.17 % of total Private residential 54% 45% New SF 35 26 New MF 4 4 Improvements 14 15 Private nonres. 25 30 Public 21 25
Current housing situation • Aug. spending: -1.5% vs. Julye, -17% vs. 8/06 • Aug. permits: -5.9% vs. July, -24% vs. 8/06 • Aug. starts: -2.6% vs. July, -19% vs. 8/06 • Aug. new-home sales: -8% vs. July, -21% vs. 8/06 • Aug. jobs: -23,000 vs. July, -155,000 vs. 8/06 • Inventories, time on market remaining high
Single-family (SF) vs. multifamily (MF) • Aug. construction spending (value put in place): SF: -3.3% vs. July, -26% vs. 8/06 MF: -0.3% vs. July, -5.3% vs. 8/06 • August housing starts : SF: -7.1% vs. July, -27% vs. 8/06 MF: +13% vs. July, +14% vs. 8/06 • August building permits : SF: -8.1% vs. July, -28% vs. 8/06 MF: unchanged vs. July, -15% vs. 8/06
Housing outlook • SF: No end yet to decline in permits, starts or spending • Don’t expect upturn before middle of ‘08 • MF: Rental construction cushioned the fall in condo starts but now many owners are trying to rent out houses and condos • Rate cut helps some buyers/homeowners but won’t cure credit fraud worries
Nonres ’06 totals, shares, ’07 YTD change Nonresidential total$545 billion100% +14% Educational $86 billion 16% +14% Commercial $76 billion 14% +15% Highway & street $72 billion 13% + 5% Office $55 billion 10% +21% Healthcare $40 billion 7% +15% Power $39 billion 7% +22% Manufacturing $34 billion 6% + 6% Transportation $27 billion 5% +11% Sewage & waste disposal $23 billion 4% + 6% Communication $21 billion 4% +20% Amusement & recreation $18 billion 3% + 9% Lodging $18 billion 3% +64% Other 7% (water; public safety; religious; conservation)
Nonresidential segments (listed in descending order of public + private spending in 2006) • Jan-Aug ’07 year-to-date (YTD) share and growth from Jan-Aug ’06 to Jan-Aug ‘07 • Major influences • Outlook for ’07 and ’08
Educational • 16% of public + private nonres. spending YTD; YTD change Jan-Aug ‘06 to Jan-Aug ‘07: 14% • Falling primary school enrollment; rising high-school, college, continuing ed • K-12 affected by property taxes, house values • Private school/college spending affected by stock market (through endowment return, gifts) • 2007 forecast: 9-11% (record bond issues in ‘06; momentum from 2005-06 revenues; stock gains) • 2008 forecast: 3-6% (slower revenue growth)
Commercial (retail, warehouse, farm) • 14% of YTD total; 15% YTD growth • Led by multi-retail (gen. merchandise, shopping centers, malls), 16% YTD growth • Neighborhood retail follows new housing; other segments affected by home sales or remodeling: furniture, appliance, yard/garden sales • 2007: +8-10% (personal income still rising but less new local, auto-, and housing-related) • 2008: +4-7% (expanding GDP but tighter credit)
Highway and street • 12% of YTD total; 5% YTD growth • Boosted by 8/05 passage of SAFETEA-LU • CBO projects big deficit starting 10/08 • 2007: +5-8% (flatter fuel tax receipts, slight relief on materials costs) • 2008: 0-5% (depends on receipts, costs)
Office • 11% of YTD total; +21% YTD growth • Rebound from weak 2001-05 • Vulnerable to reduced demand from RE agents, mortgage brokers, title companies • Tighter credit; large-firm mergers, job cuts threaten many large-office markets • 2007: +10-14% (leveling of vacancy rates, modest job growth) • 2008: +0-5% (’06 projects end, fewer new)
Power • 8% of YTD total; +22% YTD growth • Private electric power has ended 5-year slump: +22% YTD growth; public +26% • New plants, transmission lines; retrofits • Wind, solar growing but from small base • 2007: +20% (retrofits, new plants, alternatives) • 2008: more of the same (+15-25%)
Healthcare (hosp., med. bldg., special care) • 7% of YTD total; +15% YTD growth • Led by private hospitals, 16% YTD growth • Technology, new housing driving hospital (re)construction; seismic retrofit in CA • Budget constraints, decline of employer-funded care may slow hospital demand • 2007: +12-15% • 2008: +10-15%
Manufacturing • 6% of YTD total; +6% YTD growth • Catching up from 1998-2004 slump • Strong shipments, high capacity utilization • Long lead times on refineries, mining, cement plants; aircraft, heavy equipment • 2007: +5-10% (less automotive, pharma; more export-oriented plants, foreign inv.) • 2008: 4-8% (big jobs continue; fewer new)
Transportation facilities • 5% of YTD total; +11% YTD growth • Driven by growth in passengers & freight • Slower economic growth in 2007 implies less expansion • 2007: +5-8% (trucking, rail slowdown) • 2008: +5-8% (more airport, port work)
Lodging • 5% of YTD total; +64% YTD growth • Driven by higher room and occupancy rates; likely to flatten by end of ‘07 • Rebound from 2000-01 recession, post-9/11 travel slump • 2007: +40-60% (more growth in business, leisure, foreign travelers) • 2008: -5 to +5% (depends on credit)
Communication • 4% of YTD total; +20% YTD growth • Carriers consolidating but also upgrading • 2007: +15-20% • 2008: +10-15% (same trends continue)
Sewage & waste disposal • 4% of YTD total; +6% YTD growth • Housing slump means fewer new lines • Major plant and CSO upgrades • 2007: +4-6% • 2008: +1-5% (continued housing impact)
Amusement & recreation • 3% of YTD total; +9% YTD growth • Very diverse: sports venues, playgrounds, parks, convention centers, theaters • 2007, 2008: ? (big stadium projects, bond issues passed in 2006 but flatter public revenues)
Materials and components • Higher increases until recently for construction inputs than for overall economy: 12 mo. to: 12/0412/0512/068/07 Const PPI 9.1% 8.2% 4.6% 1.6% CPI-U 3.3% 3.4% 2.5% 2.5% • Higher cumulative change from 12/03 to 8/07: Const PPI 28% CPI-U 13% • PPI drivers: steel, gypsum, diesel, asphalt, concrete, copper, plastics, aluminum, wood
08/07 Cumulative Change in Consumer, Producer & Construction Prices (All PPIs = 100 in 12/03)
08/07 Cumulative Change in PPIs for Construction Types (All PPIs = 100 in 12/03)
08/07 Cumulative Change in PPIs for Selected Highway Inputs (All PPIs = 100 in 12/03)
08/07 Cumulative Change in PPIs for Selected Building Inputs (All PPIs = 100 in 12/03)
08/07 Cumulative Change in PPIs for Selected Metal Products (All PPIs = 100 in 12/03)
Outlook for materials (3-6 months) • Falling prices: wood, gypsum products; perhaps plastics • Likely to rise: diesel, asphalt, copper • No shortages but longer lead times for some items • Year-over-year PPI change: 3-5%
Outlook for materials (1-5 years) • Construction remains dependent on specific materials • Same materials in demand worldwide, with uncertain supply growth (e.g., copper, oil) • Construction requires physical delivery • Thus, industry is subject to price spurts, transport bottlenecks, fuel price swings • Expect 6-8% PPI increases, higher spikes
Construction labor costs, availability Average hourly earnings, 8/06-8/07: +4.5% • Construction employment change: -1.2% -Residential construction : -4.5% (residential building & specialty trades) -Nonresidential construction: +1.5% (nonres building & specialty trades, heavy & civil engineering const.) • Architectural, engineering services: +2.9% • Nonfarm total: jobs +1.3%, wages +3.9%
Construction labor outlook (12/07 vs. 12/06) • ‘Official’ rise in nonres. employment: 2-4% • ‘Official’ decline in res. employment: 4-6% • + 400-500K ‘res’ specialty trades in nonres • = Actual nonres. employment rise: 11-16% • Actual res. employment loss: 16-20% • Wage increase: 5% (partly due to greater proportion of nonres., hence higher-paid)
Summary for 2007 • Total const. spending: -6% to -3% Res: -15% to -20% (huge drop in new SF; MF and improvements down slightly) Nonres: +10-15% (led by energy & power, hospitals, lodging) • Materials costs: +3-5% Dec.-Dec. • Labor costs: +4.5-5.5% Dec.-Dec.
Summary for 2008 • Total construction spending: +1-5% Res: +1-3% (turnaround after mid-2008) Nonres: +3-7% (led by energy & power, hospitals; weaker highways, lodging) • Materials costs: +6-8% • Labor costs: +5-6%
AGC Economic Resources (sign up by email to simonsonk@agc.org) • The Data DIGest: weekly one-page email • PPI tables: emailed monthly • Construction Inflation Alert: Oct. & March • Audioconferences: Dec. & June • State-specific emails (timing varies) and fact sheets: www.agc.org /factsheets
Ken Simonson Chief Economist Associated General Contractors of America simonsonk@agc.org, 703-837-5313