Download
1 / 25
250 likes | 400 Views
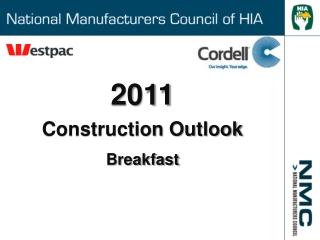
Construction & Materials Outlook. Willis Risk Management Conference San Antonio, September 20, 2012 Ken Simonson, Chief Economist AGC of America simonsonk@agc.org. Current economy; construction outlook. 2. Source: AGC. GDP, personal income, jobs: growing, but slowly

E N D
Construction & Materials Outlook Willis Risk Management Conference San Antonio, September 20, 2012 Ken Simonson, Chief Economist AGC of America simonsonk@agc.org
Current economy; construction outlook 2 Source: AGC GDP, personal income, jobs: growing, but slowly Office, retail, lodging up due to remodeling, not starts Power, mfg., warehouse/distribution, hospitals will grow ‘Shale gale,’ Panama Canal expansion driving new activity Apartments should boom; single-family still a mystery Federal, state, local construction cuts will continue Unemployment dropping but only because workers leave Materials costs not extreme but will outpace CPI
One (or many) bright spot(s): the shale ‘gale’ Cody Bakken Gammon Natural gas production Trillion cubic feet (TCF) 862 TCF shale 2,543TCF total 67% increase in shale production 2007-10 Mowry Antrim Baxter-Mancos Marcellus/ Devonian/Utica Niobrara Mancos Pierre Mulky New Albany Lewis Fayetteville Woodford Barnett- Woodford Floyd-Neal Barnett Haynesville Eagle Ford Source: EIA Annual Energy Outlook, 2008 to 2011
Shale’s direct and indirect impacts on construction 4 Source: AGC Onsite: Each well requires access road, site prep, pad, storage pond, support structures, pipes Nearby: Products, water require trucking, rail, pipeline, processing Local spending by drilling firms, workers, royalty holders Orders for fracking sand, drills, compressors, pumps, pipe, tanks, trucks, rail equipment, processing facilities Downstream: Petrochemical, power, steel plants; LNG export terminals, fueling stations; LNG-powered vehicles Losers: coal; maybe wind, solar, nuclear & suppliers
U.S. Post-Panamax Ready Ports Seattle & Tacoma Columbia River at Mouth, OR & WA New York-New Jersey Baltimore Oakland Norfolk Los Angeles/ Long Beach San Diego (with tide) Charleston (with tide) Savannah Jacksonville Mobile Miami 5 Source: U.S. Army Corps of Engineers
Panama Canal expansion’s impacts on construction 6 Source: AGC Ports: investing in dredging, piers, cranes, land access Nearby: Storage, warehouse, trucking, rail facilities Possible bridge, tunnel, highway improvements Possible changes in inland distribution, manufacturing
Construction spending (seasonally adjusted annual rate—SAAR ) Total construction, 1/08-7/12 (billion $) Public, private nonres & private res, 1/08-7/12 Latest 1-month change: -0.9% (-0.9%) (-0.4%) (-1.6%) 12-month % change, 1/11-7/12 12-month % change, 1/11-7/12 Latest 12-month change: 9.3% (11.7%) (-0.7%) (19.0%) Source: Census Bureau construction spending reports
Nonres totals (billion $, SAAR), share & 12-month change 8 Source: Census Bureau construction spending report
Construction spending: public works (billion $, SAAR) Latest 1-mo. change: -0.2%, 12-mo.: 5% Latest 1-mo. change: -1.2 %, 12-mo.: -2% Amusement & recreation (59% public) Latest 1-mo. change: -1.1%, 12-mo.: -3% Latest 1-mo. change: -1.3%, 12-mo.: -13% Source: Census Bureau construction spending reports
Construction spending: industrial, heavy (billion $, SAAR) Latest 1-mo. change: -1.2%, 12-mo.: 18% Latest 1-mo. change: -2.2%, 12-mo.: 18% Public transportation facilities Latest 1-mo. change: 2.8%, 12-mo.: 18% Latest 1-mo. change: 0.7%, 12-mo.: 11% Source: Census Bureau construction spending reports
Construction spending: institutional (private + state/local) Latest 1-mo. change: 1.8%, 12-mo.: 31% Latest 1-mo. change: 0.0%, 12-mo.: -2% Latest 1-mo. change: 1.3%, 12-mo.: 1% Latest 1-mo. change: -0.5%, 12-mo.: -7% Source: Census Bureau construction spending reports
Construction spending: developer-financed (billion $, SAAR) Latest 1-mo. change: -2.1%, 12-mo.: 8% Latest 1-mo. change: -0.1%, 12-mo.: 10% Latest 1-mo. change: -1.7%, 12-mo.: -9% Latest 1-mo. change: 0.0%, 12-mo.: 36% Source: Census Bureau construction spending reports
Priv. residential spending, permits, starts: single- & multi-family, 2008-12 Single-family & improvements spending ▬SF: 1-mo 1.5%, 12-mo 19% ▬Imp:1-mo -5.5%, 12-mo 15% Latest 1-mo. change: 2.8%, 12-mo.: 45% Multi-family permits & starts Single-family permits & starts ▬Permits (1-mo -3.0%, 12-mo 35%) ▬Starts (1-mo -4.9%, 12-mo 35%) ▬Permits (1-mo 0.2%, 12-mo 19%) ▬Starts (1-mo 5.5%, 12-mo 27%) Source: Census Bureau construction spending, housing starts reports
Housing outlook 14 Source: Author • SF: improvement so far but distressed and ‘shadow’ inventory will depress prices, limit new construction • MF: Upturn should last throughout 2012 and 2013 • Vacancy rate is now at 10-year low; rents are up • Rental demand should rise as more people get jobs • But condo market continues to have large overhang • And government-subsidized market likely to worsen • The big mystery: Have preferences changed to favor renting, close-in locations (=> more MF, less SF)?
Construction vs. overall (un)employment, 8/10-8/12 • Private sector has added jobs since 1/10, construction since 1/11 • Construction added 0 jobs in 2 years but unemployment is down • Thus, workers are leaving for other sectors, school, retiring Construction vs. private employment, 8/10-8/12 (seasonally adjusted, cumulative % change since 8/10) Unemployment rates (August 2010-August 2012) Private 3.6% 3,897,000 Construction 0.1%, 4,000 Source: BLS employment, unemployment reports
State construction employment change (U.S.: 0.1%) 7/11 to 7/12 (seasonally adjusted): 18 + DC up, 31 down, 1 unch -10% or worse -5.0% to -9.9% -0.1% to -4.9% 0% to 4.9% 5.0% to 9.9% 10% or better 1% -0.3% 4% -4% NH-2% 4% 16% 2% -5% -8% -2% VT 1% -5% -3% 5% -8% -2% 3% MA-4% -1% 10% 1% -5% 8% 6% 8% -9% -1% CT-6% RI4% 1% -4% 7% -2% DE-7% NJ-6% -1% 4% -1% 4% -10% -3% -5% -8% -11% MD -0.2% DC12% -0.3% -5% -15% 16 Source: BLS state and regional employment report HI0%
Material & labor costs vs. office & highway bid prices, 3/09-8/12 PPI for materials ECI PPI for offices NHCCI Source: Author, based on Bureau of Labor Statistics for Producer Price Indexes (PPIs) and Employment Cost Index (ECI); Federal Highway Administration for National Highway Construction Cost Index (NHCCI)
PPIs for inputs vs. bid prices, 1/11-8/12 (January 2011=100) PPI for inputs to commercial structures PPI for new offices PPI for inputs for other nonres (highway, heavy) Natl. Highway Construction Cost Index (NHCCI) Source: Author, based on BLS reports (PPI), Federal Highway Administration reports (NHCCI)
Producer price indexes for key inputs, 1/11-8/12 (January 2011=100) Steel mill products Copper & brass mill shapes Gypsum products Lumber & plywood Source: Author, based on BLS producer price index reports
Producer price indexes for key inputs, 1/11-8/12 (January 2011=100) No. 2 diesel fuel Concrete products Asphalt paving mixtures & blocks Prepared asphalt & tar roofing & siding materials Source: Author, based on BLS producer price index reports
Outlook for materials 21 Source: Author • Industry depends on specific materials that: • are in demand worldwide • have erratic supply growth • are heavy, bulky or hard to transport • Construction requires physical delivery • Thus, industry is subject to price spurts, transport bottlenecks, fuel price swings • Expect 3-5% Dec-Dec PPI increase but volatility still a risk
Summary for 2012 22 Source: Author Private nonres spending: +10 to +15% (more power, pipelines, mfg., warehouse, hospitals, maybe higher ed) Public: 0 to -5% (highways, educational 0%, other transp. -5%; continued weak state-local spending) Res: +5% to +15% (SF and imp. up a bit, MF very strong) Total construction spending: +3 to +9% Materials costs: +4% to +9%; +3 to +5% Dec.-Dec. Labor costs: +1.5% to +2.5%
Trends: 2013-2017 23 Source: Author • Total construction spending: +6% to +10% per year - less housing, retail; declining public spending - new drivers: shale-based gas & oil; Panama Canal widening; more elderly & kids, fewer young adults • Materials costs: +3% to +8% (vs. 2% to 3% for CPI) • Labor costs: +2% to + 4% • Bid prices: +2% to +5%
AGC economic resources (email simonsonk@agc.org) 24 • The Data DIGest: weekly 1-page email (subscribe at: www.agc.org/datadigest) • 5 monthly press releases: national, state, metro employment; spending; PPI • State and metro data, fact sheets • Webinars • Website: http://www.agc.org/Economics