Download
1 / 16
160 likes | 249 Views
Photograph Courtesy of Union of Concerned Scientists Website. China Leads in Co2 Emissions, But the US Has the Largest Footprint. China 5 tons of CO2 per head; European Union 10 tons of CO2 per head USA 20 tons CO2 per head

E N D
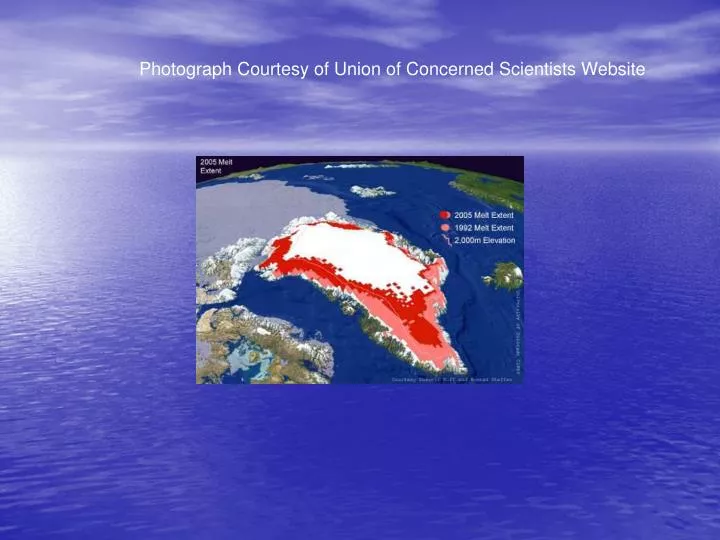
Photograph Courtesy of Union of Concerned Scientists Website
China Leads in Co2 Emissions, But the US Has the Largest Footprint China 5 tons of CO2 per head; European Union 10 tons of CO2 per head USA 20 tons CO2 per head Much of China’s CO2 is produced manufacturing Products for U.S. consumer
Wind Turbines Reduce CO2 For each wind turbine installed, an average of 1,000 tons of CO2 emissions are avoided International Carbon Bank & Exchange: Carbon Database, CO2 Reduction Calculator
Wind Farms in the U.S. 2006 Courtesy of the American Wind Energy Assoc. The top five states in new installations were Texas (774 MW), Washington (428 MW), California (212 MW), New York (185 MW) and Minnesota (150 MW)
Wind Power’s Influence is Growing • Growing rapidly worldwide on a percentage basis (25% annually from 2002-2006); • Total installed U.S. wind capacity at year's end 2006 was 11,603 MW - equivalent of nearly 3 million average households (hh of 8 million people); • Globally, 15,197 MW of new wind capacity was added in 2006. Current installed capacity worldwide at the end of 2005 was 74,223 MW; • Denmark and some regions of Spain and Germany now have 10% to 25% of electricity generated from wind power • Source: American Wind Energy Association
What Wind Power Can do for its Country • U.S. wind turbines produce enough electricity to meet the needs of more than 3 million households • A single modern wind turbine can produce enough power to meet the annual electricity needs of 500 average homes.
State Legislation 2007 Oregon Legislature adopted law that 25% of electricity come from clean, homegrown renewable energy sources by 2025; Oregon - no parallel land use “supersiting” or expedited siting policies; Washington has expedited siting policies Wa. Governor authority to preempt local land use decisions
Issues • Aesthetics • Noise • Ice Fall • Turbine collapse • Wind Turbine Syndrome • Wildlife – particularly avian and bat impacts
Comparison of Avian Wind Power Mortality with Other Human Influences Annual mortality estimate Percent composition Buildings 550 million 58.2 percent Power lines 130 million 13.7 percent Cats 100 million 10.6 percent Automobiles 80 million 8.5 percent Pesticides 67 million 7.1 percent Communications towers 4.5 million 0.5 percent Wind turbines 28.5 thousand <0.01 percent Airplanes 25 thousand <0.01 percent Other sources (oil spills, oil seeps, fishing by-catch, etc.) not calculated Summary and Comparison of Bird Mortality from Anthropogenic Causes with an Emphasis on Collisions: Erickson, Johnson and Young (2005)
Report To The Congressional Defense Committees: The Effect of Windmill Farms On Military Readiness 2006: No wind farm within radar line of sight Report June 2007 DOD Specific to Cape Wind – Mitigation –wind farm ok so long as establish 25 km wind turbine offset or buffer zone to "mitigate impact" Potential Adverse Effects on Radar Can Be Mitigated
Land Use Battles • Lathrop v. State Energy facility Site Evaluation Council, 130 Wash. App 147, 121 P3d 774 (2005) (affirming expedited facility siting). • Ecogen LLC v. Town of Italy, 438 FSupp2d 149 (2006) (aff’d 2 year moratorium on wind siting projects). • Bomba v. Zoning Board of Appeals of the Town of Princeton, 2005 WL 2106162 (September 1, 2005) (unreported) (wind power facility flunks 35 ft. height restriction) • Womble v. Wasco County, ___ Or LUBA ___ (LUBA No. 2006-241, April 10, 2007) (due dilligence work for temporary facilities subjected to land use standards).
Cape Wind – America’s First Offshore Wind Power Facility • Issue: Should a wind farm be built in Nantucket Sound? • High profile legal, political and legislative battle raging for more than 5 years • Temporary facility finally approved and recording good energy prospects • DOD lifted radar conflict obstacle June 2007 • Still long way to go permits hoped for in 2008 – turbine construction and installation 2010
Navigating Multi-jurisdictional Hurdles Most projects require determination of compatibility with local land use rules; State energy siting authorities must approve; Off Shore – Army Corps of Engineers (submerged lands); US Minerals Management Service (continental shelf beyond three mile limit); NOAA (National Marine Sanctuaries Act and the Magnuson-Stevens Fishery Conservation Act); FERC; FAA; DOD; Dept. Homeland Security; Proposed FERC Rules for Off Shore Projects