Download
1 / 80
800 likes | 960 Views
An Overview of South Africa’s Schooling System. www.nicspaull.com/research Michael & Susan Dell Foundation | 24 March 2014. Essentially 2 schooling systems in SA. 1) South Africa performs extremely poorly on local and international assessments of educational achievement.

E N D
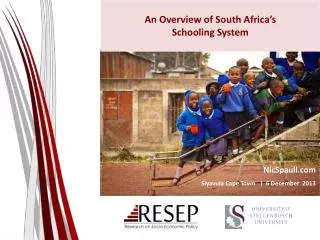
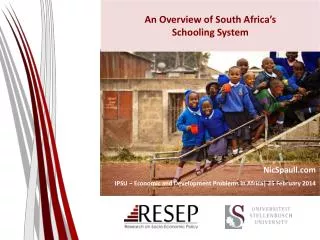
An Overview of South Africa’s Schooling System www.nicspaull.com/research Michael & Susan Dell Foundation | 24 March 2014
1) South Africa performs extremely poorly on local and international assessments of educational achievement
State of SA education since transition • “Although 99.7% of South African children are in school…the outcomes in education are abysmal” (Manuel, 2011) • “Without ambiguity or the possibility of misinterpretation, the pieces together reveal the predicament of South African primary education” (Fleisch, 2008: 2) • “Our researchers found that what students know and can do is dismal” (Taylor & Vinjevold, 1999) • “It is not an overstatement to say that South African education is in crisis.” (Van der Berg & Spaull, 2011)
Student performance 2003-2011 prePIRLS(2011) TIMSS (2011) ANA (2011) TIMSS (2003) PIRLS (2006) SACMEQ (2007) TIMSS 2003 (Gr8 Maths & Science) • Out of 50 participating countries (including 6 African countries) SA came last • Only 10% reached low international benchmark • No improvement from TIMSS 1999-TIMSS 2003 PIRLS 2006(Gr 4/5 – Reading) • Out of 45 participating countries SA came last • 87% of gr4 and 78% of Gr 5 learners deemed to be “at serious risk of not learning to read” SACMEQ III 2007(Gr6 – Reading & Maths) • SA came 10/15 for reading and 8/15 for maths behind countries such as Swaziland, Kenya and Tanzania ANA 2011 (Gr 1-6 Reading & Maths) • Mean literacy score gr3: 35% • Mean numeracy score gr3: 28% • Mean literacy score gr6: 28% • Mean numeracy score gr6: 30% TIMSS 2011(Gr9 – Maths & Science) • SA has joint lowest performance of 42 countries • Improvement by 1.5 grade levels (2003-2011) • 76% of grade nine students in 2011 still had not acquired a basic understanding about whole numbers, decimals, operations or basic graphs, and this is at the improved level of performance prePIRLS2011 (Gr 4 Reading) • 29% of SA Gr4 learners completely illiterate (cannot decode text in any langauge) • NSES 2007/8/9 • Systemic Evaluations 2007 • Matric exams
2) In large parts of the schooling system there is little learning taking place
Quantifying learning deficits in Gr3 Figure 1: Kernel density of mean Grade 3 performance on Grade 3 level items by quintiles of student socioeconomic status (Systemic Evaluation 2007) • Following Muralidharan & Zieleniak (2013) we classify students as performing at the grade-appropriate level if they obtain a mean score of 50% or higher on the full set of Grade 3 level questions. (Grade-3-appropriate level) 16% Only the top 16%of grade 3 students are performing at a Grade 3 level 51% 11%
NSES question 42NSESfollowed about 15000 students (266 schools) and tested them in Grade 3 (2007), Grade 4 (2008) and Grade 5 (2009). Grade 3 maths curriculum: “Can perform calculations using appropriate symbols to solve problems involving: division of at least 2-digit by 1-digit numbers” Even at the end of Grade 5 most (55%+) quintile 1-4 students cannot answer this simple Grade-3-level problem. “The powerful notions of ratio, rate and proportion are built upon the simpler concepts of whole number, multiplication and division, fraction and rational number, and are themselves the precursors to the development of yet more complex concepts such as triangle similarity, trigonometry, gradient and calculus” (Taylor & Reddi, 2013: 194) (Spaull & Viljoen, forthcoming)
By Gr 3 all children should be able to read, Gr 4 children should be transitioning from “learning to read” to “reading to learn” Red sections here show the proportion of children that are completely illiterate in Grade 4 , i.e. they cannot read in any language
SACMEQ 2007 – Grade 6 By this definition of functional illiteracy, if students are functionally illiterate they cannot read a short and simple text and extract meaning i.e. they cannot read for meaning
Insurmountable learning deficits(Spaull & Viljoen, forthcoming – SAHRC Report 2014)
Insurmountable learning deficits: 0.3 SD Spaull & Viljoen, 2014 (SAHRC Report)
550,000 students drop out before matric • 99% do not get a non-matric qualification (Gustafsson, 2011: p11) • What happens to them? 50% youth unemployment.
Dropoutbetween Gr8 and Gr12 • Of 100 Gr8 quintile 1 students in 2009, 36 passed matric and 10 qualified for university • Of 100 Gr8 quintile 5 students in 2009, 68 passed matric and 39 qualified for university • “Contrary to what some would like the nation and the public to believe that our results hide inequalities, the facts and evidence show that the two top provinces (Free State and North West) are rural and poor.” (Motshekga, 2014)
What are the root causes of low and unequal achievement? Matric pass rate Subject choice Throughput No. endorsements Media sees only this MATRIC Quality? Pre-MATRIC 50% dropout Low curric coverage Low accountability Weak culture of T&L Vested interests Low time-on-task No early cognitive stimulation Low quality teachers HUGE learning deficits…
4) In South Africa we have TWO public schooling systems not one
SA’s two schooling systems 75% | 25% (Spaull, 2013)
Bimodality – indisputable fact PIRLS/ TIMSS/ SACMEQ/ NSES/ ANA/ Matric… by Wealth/ Language/ Location/ Dept…
Education and inequality? • IQ • Motivation • Social networks • Discrimination
Labour Market • University/FET • Type of institution (FET or University) • Quality of institution • Type of qualification(diploma, degree etc.) • Field of study (Engineering, Arts etc.) • High productivity jobs and incomes (17%) • Mainly professional, managerial & skilled jobs • Requires graduates, good quality matric or good vocational skills • Historically mainly white High quality secondaryschool Unequal society High SES background +ECD High quality primary school Minority (20%) Some motivated, lucky or talented students make the transition • Vocational training • Affirmative action • Big demand for good schools despite fees • Some scholarships/bursaries Majority (80%) Quality Type Attainment Low quality secondary school • Low productivity jobs & incomes • Often manual or low skill jobs • Limited or low quality education • Minimum wage can exceed productivity Low SES background Low quality primary school cf. Servaas van der Berg – QLFS 2011
RECAP • Essentially 2 schooling systems in SA
Way forward? • Acknowledge the extent of the problem • Low quality education is one of the three largest crises facing our country (along with HIV/AIDS and unemployment). Need the political will and public support for widespread reform. • Focus on the basics • Every child MUST master the basics of foundational numeracy and literacy these are the building blocks of further education – weak foundations = recipe for disaster • Teachers need to be in school teaching (re-introduce inspectorate?) • Every teacher needs a minimum competency (basic) in the subjects they teach • Every child (teacher) needs access to adequate learning (teaching) materials • Use every school day and every school period – maximise instructional time • Have to make sure we don’t make the same mistakes with Grade R as we have with the rest of schooling • Increase information, accountability & transparency • At ALL levels – DBE, district, school, classroom, learner • Strengthen ANA. Get psychometrics right (so comparable across years), externally evaluate @ 1 grade • Set realistic goals for improvement and hold people accountable • Focus on teachers • Have to find a way of raising the quality of both (1) new, but especially (2) existing teachers • Q&A - Prof Muller (UCT): What do you think is the most under-researched area in South African education? • “We have no idea what it will take to make knowledgeable teachers out of clueless ones, at least not while they are actually on-the-job.”
Further issues we can discuss • Solution: Accountability & capacity • Solution: Identifying binding constraints • Mathematics teacher CK in SA • Grade R in SA • New and existing RESEP projects • What proportion of SA kids make it to uni? • Things to think about when introducing automated/tech solutions in SA (or anywhere) • Especially with reference to Dell Dashboards
Thank youComments & Questions?This presentation and papers available online at:www.nicspaull.com/research
Things to think about when introducing automated/tech solutions in SA (or anywhere) • Particularly with reference to DELL Dashboards • Need for a theory of improvement • “If policy-makers rely on incentives for improving either a school or a student, then the question arises, incentives to do what? What exactly should educators in failing schools do tomorrow - that they do not do today - to produce more learning? What should a failing student do tomorrow that he or she is not doing today? “ (Loveless, 2005) • “Giving test results to an incoherent, atomized, badly run school doesn’t automatically make it a better school. The ability of a school to make improvements has to do with the beliefs, norms, expectations, and practices that people in the organization share, not with the kind of information they receive about their performance. Low-performing schools aren’t coherent enough to respond to external demands for accountability … Low-performing schools, and the people who work in them, don’t know what to do. If they did, they would be doing it already. You can’t improve a school’s performance, or the performance of any teacher or student in it, without increasing the investment in teachers’ knowledge, pedagogical skills, and the understanding of students. This work can be influenced by an external accountability system, but it cannot be done by that system” (Elmore, 2002, 5-6 cited in Shalem, 2003: 41). • “In order for an accountability system to be based on improvement, it has to embody an underlying theory of how schools improve their performance. Simply constructing an incentive structure of standards and testing around the expectation of steady improvements in performance is not a theory of improvement. A theory of improvement actually has to account for how people in schools learn what they need to know in order to meet the expectations of the accountability system” (Elmore, 2004a, p. 21). • (On this point see diagrams on Accountability and Capacity)
Things to think about when introducing automated/tech solutions in SA (or anywhere) • What are the checks and balances to reduce the probability of misclassification? • Perverse incentives • What proportion of total students wrote the ANA relative to SNAP/ASS? (potential to exclude weaker students to inflate results) • Threshold? 95%? • What monitoring / external evaluation procedures are in place to ensure teachers do not influence results (either directly helping or marking leniently? • Externally evaluate the ANAs at one grade • Data issues • What proportion of the data was captured on which the analysis/classification rests? • Threshold? 95%? • What to do when the # of students writing or # of observations captured fall below threshold? Automatically categorize/downgrade? • Campbell’s Law • ”The more any quantitative social indicator (or even some qualitative indicator) is used for social decision-making, the more subject it will be to corruption pressures and the more apt it will be to distort and corrupt the social processes it is intended to monitor.”
What proportion of marks captured by grade and province?!Why so little in certain grades/provinces?Likely to be non-random.
Qualifications by age (birth cohort), 2011 (Van der Berg, 2013)
Grade R/ECD issues needing to be fleshed out? • Qualitatively/practically, when is enrolment considered “Grade R” and when just child-minding? • Where should Grade R teachers be trained? • Universities? More of the same? • FET colleges? Quality problems? Status? • Practically, how does one monitor quality of ECD? What instruments? What surveys? • What should Grade R teachers be paid? • Teacher salaries (and class sizes) obviously major cost-drivers
SOLUTION? Accountability AND Capacity
“Only when schools have both the incentive to respond to an accountability system as well as the capacity to do so will there be an improvement in student outcomes.” (p22)
“The left hand barrel has horizontal wooden slabs, while the right hand side barrel has vertical slabs. The volume in the first barrel depends on the sum of the width of all slabs. Increasing the width of any slab will increase the volume of the barrel. So a strategy on improving anything you can, when you can, while you can, would be effective. The volume in the second barrel is determined by the length of the shortest slab. Two implications of the second barrel are that the impact of a change in a slab on the volume of the barrel depends on whether it is the binding constraint or not. If not, the impact is zero. If it is the binding constraint, the impact will depend on the distance between the shortest slab and the next shortest slab” (Hausmann, Klinger, & Wagner, 2008, p. 17).
4 “Take-Home” points Many things we have not discussed – Grade-R/ECD, teacher unions, LOLT, teacher training (in- and pre-), RCTs etc. • South Africa performs extremely poorly on local and international assessments of educational achievement. • In large parts of the schooling system there is very little learning taking place. • In SA we have two public schooling systems not one. • Strategies for improvement need to focus on 1) accountability, 2) capacity, 3) alignment.
Decreasing proportion of matrics taking mathematics Table 4: Mathematics outputs since 2008 (Source: Taylor, 2012, p. 4)