Download
1 / 33
350 likes | 511 Views
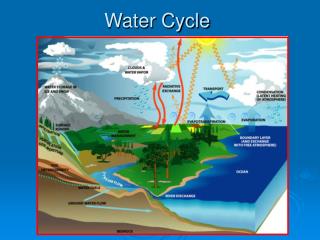
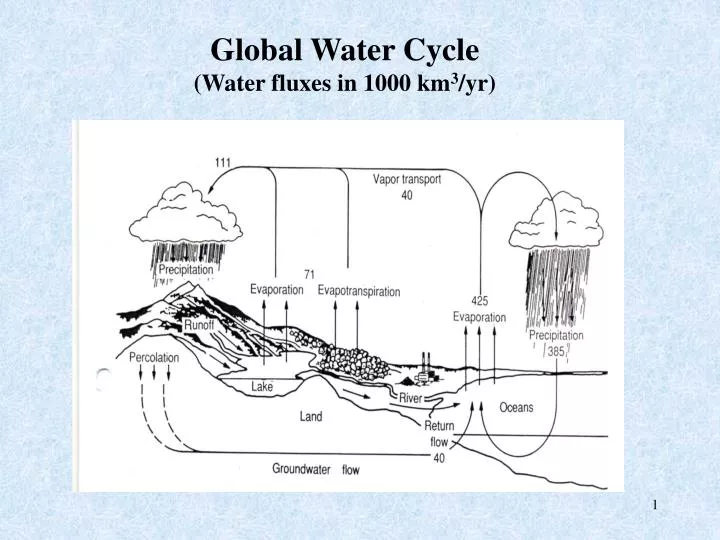
Global Water Cycle (Water fluxes in 1000 km 3 /yr). Latitudinal Trends in Global P and E. Equilibrium Fractionation between Water Vapor and Liquid. Temperature Dependence of Equilibrium Fractionation for Water Phases. e (‰) d 18 O. e (‰) d D. α = R(liq) / R(gas).

E N D
Temperature Dependence of Equilibrium Fractionationfor Water Phases e (‰) d18O e (‰) dD α = R(liq) / R(gas)
Rayleigh Distillation Predictiond18O vs Temp d18O = -5 ‰ dD = -32 ‰ d18O = -2 ‰ dD = -7 ‰
dD vs d18O for Global Precipitation d18O (‰) dD (‰)
dD of Precipitation Globally dD of Precipitation in N. America
Deviations from MWL • Although global pattern of d18O and dD of precipitation follows MWL, there can be significant deviations. • Mainly in arid regions, where evaporation is important. • Use Deuterium Excess to quantify departure from MWL. • Implication is that evaporation can play a significant role in the isotopic composition of precipitation by imposing kinetic, rather than equilibrium, isotope effects.
dD vs d18O in Arid Regions Rio Grande (Southwest US) and Darling (Central Australia) In arid regions, dD vs d18O slope is significantly less than 8 of MWL.
d18O of Precip at Tropical Sites with Seasonal Cycle in Humidity
Deuterium Excess d-excess (‰) = dD (‰) – 8* d18O (‰) d-excess of MWL = 10 (‰) Prediction: d-excess depends on Relative Humidity
Effect of humidity on dD vs d18O slope MWL Lakes W. Washington Lakes E. Washington
d18O versus Borehole Paleothermometrya controversy in Greenland Ice Cores (DTemp/Dd18O= 1.5 ºC / ‰) Current Precipitation DTemp/Dd18O= 3 ºC / ‰ Borehole Temps Climate scientists favor the borehole temperature changes.
Greenland Ice Core d18O and Temperature Record Using borehole temperature vs d18O calibration
SeasonalRecords of d18O and dD in Precipitation Temp d18O dD
d18O and dD as a Water Source Tracer in Steams and Rivers dD (‰) Five European Rivers d18O (‰) 22 = Rhine River
d18O and dD in US Rivers Missouri R. Mississippi R. L Meramac R.?
Surface Ocean d18O (‰ vs SMOW) (LeGrande, GRL 2006)