Download
1 / 30
310 likes | 424 Views
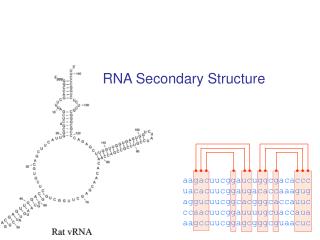
Improving the prediction of RNA secondary structure by detecting and assessing conserved stems. Xiaoyong Fang, et al. Outline. Background Related work Methods Results Discussion. Background.

E N D
Improving the prediction of RNA secondary structure by detecting and assessing conserved stems Xiaoyong Fang, et al
Outline • Background • Related work • Methods • Results • Discussion
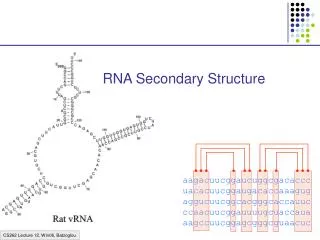
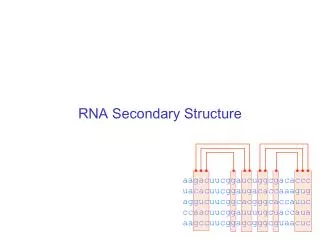
Background • Non-coding RNAs gained increasing interest since a huge variety of functions associated with them were found • The function of an RNA molecule is principally determined by its (secondary) structure • Unfortunately, the current physical methods available for structure determination are time-consuming and expensive
cont. • The prediction of RNA secondary structure can be facilitated by incorporating with comparative analysis of homologous sequences • However, most of existing comparative methods are vulnerable to alignment errors and thus are of low accuracy in practical application • And the methods for simultaneous sequence alignment and structure prediction are too computationally taxing to be practical
Related work • Zuker, et al: Mfold, 1981, 2003 • Knudsen, B. and J. Hein: Pfold, 1999, 2003 • Hofacker, I., M. Fekete, and P. Stadler: RNAalifold, 2002 • Ruan, J., et al: 2004 • Knight, R., et al: 2004 • Weinberg, Z. and W.L. Ruzzo: 2004
cont • Sankoff, D: 1985 • Hofacker, I., S. Bernhart, and P. Stadler: 2004 • Mathews, D. and D. Turner: 2002 • Mathews, D: 2005 • ……etc.
Method 1) We detect possible stems in single RNA sequence using the so-called position matrix with which some possibly paired positions can be uncovered. 2) We detect conserved stems across multiple RNA sequences by multiplying the position matrices. 3) We assess the conserved stems using the Signal-to-Noise. 4) We compute the optimized secondary structure by incorporating the so-called reliable conserved stems with predictions by RNAalifold program.
Detect possible stems in single RNA sequence • Given an RNA sequence of length N, Seq, we build one N×N position matrix (denoted by MSeq) by: 1) The reverse complement of Seq, Seq’, is firstly computed from the original sequence. 2) We build one N×N matrix containing Seq’ in the first row. The i-th (0 ≤ i ≤ N-1) row contains the sequence generated from Seq’ by shifting i position to the left (circular left shift).
Cont. 1 3) The position matrix MSeq is computed by comparing Seq with the matrix generated by 2) row by row. 0 or 1 or -1 is assigned to the i, j (0 ≤ j ≤ N-1) element of MSeq by comparing the j-th character of Seq with the i, j (0 ≤ j ≤ N-1) element of the matrix of 2). The following rules should be obeyed when two characters (b and b’) are compared with each other: • If b equals b’and neither of them is ‘_’, then 1 is assigned. • If b or b’is ‘_’ or both of them are ‘_’, then -1 is assigned. • If b does not equal to b’and neither of them is ‘_’, then 0 is assigned.
Cont. 2 • We can detect all possible stems in an RNA sequence by scanning the position matrix row by row. The key is to find all zones of continuous “1” in the matrix. There is a one-to-one mapping between the stems in the sequence and the zones of continuous “1” in the position matrix.
Detecting conserved stems across multiple sequences • The multiplying of the position matrices • M [i, j] = M1 [i, j] × M2 [i, j]; • 0×0 = 0; 0×1 = 0; 0× (-1) = 0. 1×1 = 1; 1× (-1) = 1. (-1)× (-1) = -1. • M =
Cont. 1 • We detect conserved stems shared by all sequences in an alignment by: 1) We extract all sequences from the alignment and detect all possible stems in each sequence using the approach described above. 2) We select n different stems from n sequences (one stem for one sequence). Here, n is the number of sequences in the alignment. 3) We build the position matrix for each selected stem using the approach described above and multiply these n matrices according to the rules mentioned above.
Cont. 2 4) We detect conserved stems by finding zones of continuous ‘1’ in the resulting matrix (M) generated by 3). There is still a one-to-one mapping between the conserved stems and the zones of continuous ‘1’ in M. 5) We repeat the steps 2) to 4) until all the stems detected by 1) are selected.
Cont. 3 • Note: Actually, the multiplying of the position matrices can be directly used to detect conserved stems in the RNA alignment. But here, we first extract all sequences from the RNA alignment and then detect conserved stems shared by all sequences. The benefit for this is that some conserved stems possibly missed due to alignment errors also can be detected.
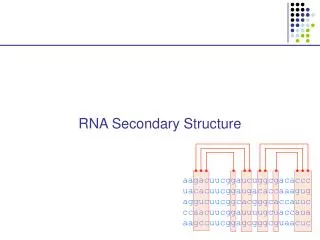
Example Figure 2
Assessing the conserved stems using the Signal-to-Noise • The main steps are: 1) We record the number of column pairs (see Figure 3) in the conserved stem as the Signal. 2) We generate a randomized alignment from the original alignment of the conserved stem. 3) We detect possibly conserved stems in the new alignment using the approach mentioned above.
Cont. 4) We record the number of column pairs in the conserved stem newly detected by 3) as the Noise. The Signal-to-Noise is thus computed by Signal / Noise. Note that, we set Noise to be 1 if there are no conserved stems in the randomized alignment, and we set Noise to be the maximum if there are more than one conserved stems.
Example Figure 3
Computing the optimized secondary structure • The main steps are: 1) We compute a candidate secondary structure using RNAalifold, which is a popular and powerful program for predicting RNA secondary structure at present. 2) We extract all sequences from the RNA alignment and detect all possibly conserved stems shared by them. 3) We compute the Signal-to-Noise for each conserved stem. 4) We remove incompatible conserved stems and determine the reliable conserved stems according to the Signal-to-Noise.
Cont. 1 Here, reliable conserved stems refer to following two kind of conserved stems: • The conserved stems with very high Signal-to-Noise. They are thought to belong to a real RNA secondary structure in our method. • The conserved stems with very low Signal-to-Noise. They are not thought to belong to any real RNA secondary structure in our method.
Cont. 2 5) We add the base pairs which are included by the first kind of reliable conserved stems but not included by the prediction by RNAalifold into the candidate secondary structure. 6) We remove the base pairs which are included by both the second kind of reliable conserved stems and the prediction by RNAalifold from the candidate secondary structure. 7) We compute the final secondary structure by merging the results of 5) and 6).
Results • We construct one data set of three-sequence alignments, one data set of four-sequence alignments and one data set of five-sequence alignments on the basis of Rfam 8.0. • We compute the sensitivity as the number of true positives divided by the sum of true positives + false negatives, and the specificity as the number of true positives divided by the sum of true positives + false positives。
Cont. 1 Table 1 - Sensitivity and specificity on data set of three-sequence alignments Id, percentage identity; Se, sensitivity; Sp, specificity.
Cont. 2 Table 2 - Sensitivity and specificity on data set of four-sequence alignments Id, percentage identity; Se, sensitivity; Sp, specificity.
Cont. 3 Table 3 - Sensitivity and specificity on data set of five-sequence alignments Id, percentage identity; Se, sensitivity; Sp, specificity.
Discussion • In this paper, we present a stem-based method to improve the prediction of RNA secondary structure. The central idea of our method is to detect and assess conserved stems shared by all sequences in the input RNA alignment, and then to compute the optimized secondary structure by incorporating reliable conserved stems with predictions by RNAalifold.
Cont. 1 • Our method improves RNAalifold by two major means: 1) to add some conserved stems which are possibly missed by RNAalifold for improving the sensitivity; 2) to remove some conserved stems which are possibly mistaken by RNAalifold for improving the specificity. • We tested our method on data sets of RNA alignments taken from the Rfam database. Experimental results suggest that our method can predict RNA secondary structure with much better performance than RNAalifold.
Cont. 2 • In future work, our method can be improved by: 1) To compute the Signal-to-Noise in more effective ways. 2) To determine the reliable conserved stems by more intelligent approaches. 3) To devise new parallel algorithms to speed up the method. 4) Further benchmark for evaluating the performance of the method.
Thank you very much! Please contact xyfang@nudt.edu.cn for any questions.