Download
1 / 24
240 likes | 324 Views
Modelling Emergency Medical Services. Paul Harper, Vince Knight, Janet Williams Leanne Smith, Julie Vile, Jonathan Gillard, Israel Vieira. Forecasting. Location. Response. Forecasting. Location. Response. Data & Demand Patterns. WAST daily demand (01/04/2005-31/12/2009).

E N D
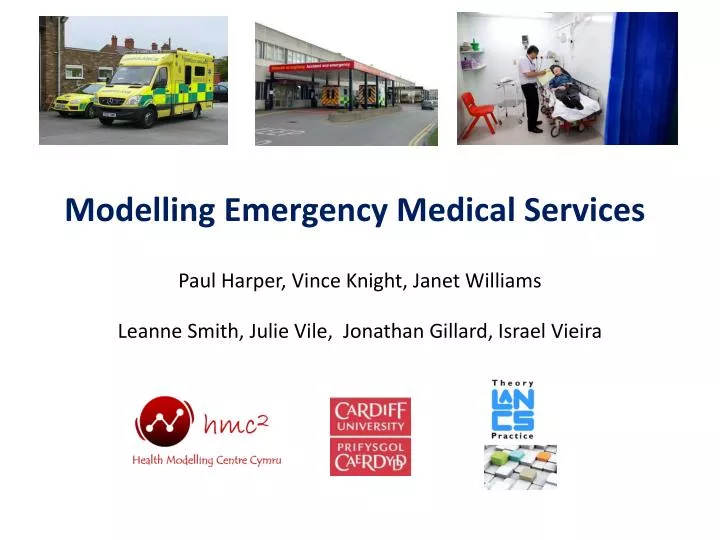
Modelling Emergency Medical Services Paul Harper, Vince Knight, Janet Williams Leanne Smith, Julie Vile, Jonathan Gillard, Israel Vieira
Forecasting Location Response
Forecasting Location Response
Data & Demand Patterns WAST daily demand (01/04/2005-31/12/2009)
Forecasting Location Response
Time-dependent Queues • If all servers are busy and only Category B/C patients are in the system, the equilibrium conditions for the state triple S=[i,h,l] are given by:
Shift Patterns CONSTRAINTS: • Max weekly working hours • Max night time hours • Rest breaks / days off OBJECTIVES: • Minimise labour hours • Minimise crew size • Minimise overtime
Forecasting Location Response
Location Analysis EAs RRVs
‘What if?’ Scenarios • Alter demand (e.g. increase by 10%) • Major event • Change in overall fleet capacity • Determine vehicle allocations given different fleet capacities • Reduce turnaround time