Download

1 / 7
70 likes | 150 Views
Linear Inequality Test Review. Algebra 1. Inequality Races. Students will be divided by rows. Students will race to solve an inequality one step at a time

E N D
Linear Inequality Test Review Algebra 1
Inequality Races • Students will be divided by rows. • Students will race to solve an inequality one step at a time • When a student finishes their step they must pass the problem on to the next student on their team until the inequality is solved and graphed. • The first team to completely solve and graph the inequality wins that round. • It is alright for students to complete more than one step in a problem as long as everyone else has take at least one turn. • Each place finisher wins the appropriate number of points: • 5 points for 1st • 4 points for 2nd • 3 points for 3rd • 2 points for 4th • 1 points for 5th
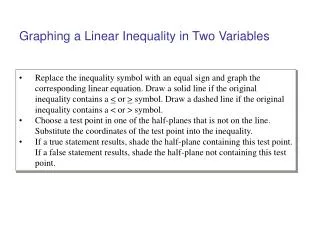
6.1-6.2 solving one- and two-step linear inequalities Solve and graph each inequality. • In #3, is 6 a member of the solution set?
6.3 solving compound inequalities Solve and graph each inequality.
6.4 solving absolute value inequalities Solve and graph each inequality.
6. 5 solving inequalities with two variables Solve and graph each inequality.
6.6 – 6.7 mean, median, mode, stem-and-leaf, and box-and-whisker plots Use the following set of data: 4, 1, 1, 10, 8, 26, 12, 13, 20 What is the mean? What is the median? What is the mode? Construct a stem-and-leaf plot. Construct a box-and-whisker plot.