Download
1 / 6
60 likes | 233 Views
Vocabulary. Parameter: a number that describes the populationStatistic: a number that is computed from the sample data; usually used as an estimate of the true parameter Sampling distribution: a distribution of the same statistic (for our purposes ) taken from ALL possible samples of the

E N D
1. 9.1: Sampling Distributions
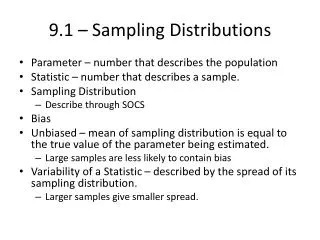
2. Vocabulary Parameter: a number that describes the population
Statistic: a number that is computed from the sample data; usually used as an estimate of the true parameter
Sampling distribution: a distribution of the same statistic (for our purposes ) taken from ALL possible samples of the same size from the population.
3. Variability versus Bias Variability: each sample of the same size taken from the population is likely to vary from other samples of the same size from the same population.
Bias: a statistic is biased if the mean of its sampling distribution not equal to the value of the true parameter.
4. High/low? Variability/bias? Determine if each diagram illustrates high or low variability and bias.
5. High/low? Variability/bias?
6. 9.13 An opinion poll asks, �Are you afraid to go outside at night within a mile of your home because of crime? Suppose that the proportion of all adults who would say �Yes� to this question is p = .4.
a) Simulate the result with an SRS of twenty adults. Compute .
b) Graph the results of 5, 10, 20, and 30 samples. Compute the mean and standard deviation for each sampling distribution. Is each result unbiased?
c) Suppose you made a sampling distribution of all possible SRS�s of twenty adults from this population. What would the mean and standard deviation be?
d) If the population proportion changed to p=.5, what would the mean of the sampling distribution become?