Download
1 / 19
190 likes | 211 Views
Explore the heights of women as a sampling distribution example, analyze empirical rules, sampling variability, and unbiased statistics. Learn about population parameters, sample statistics, and the relationship between means. Engage in exercises and examples to grasp statistical concepts effectively.

E N D
Chapter 9.1: Sampling Distributions Mr. Lynch AP Statistics
The Heights of Women • The heights of women in the world follow: N(64.5, 2.5) … Explain … • Let’s draw a sketch that helps illustrate this • MATH … PRB … 6:randNorm(64.5,2.5) • Stand up if your value is between [62, 67] • Stand up if your value is between [59.5, 69.5] • Stand up if your value is between [57, 72]
The Heights of Women • MATH … PRB … 6:randNorm(64.5,2.5, 100) • STO L1 • 1-Var Stats: Mean? Median? S? • STAT PLOT 1: Histogram … L1, 1 • WINDOW: X:[57,72, 2.5] …Y:[-10,60,10] • STAT PLOT 2: Boxplot … L1, 1 • TRACE Histogram … Enter frequencies is chart • Repeat three times … fill out frequency chart as shown
70.7 95.0 99.4 The Heights of Women
The Heights of Women • How did the “Empirical Rule” work out for you? • What do the Shape, Center, and Spread look like? • Let’s look at the n = 7500 histogram! • How are we doing now? • Conclusion: This distribution is just a miniature version of the population distribution with same mean and standard deviation
The Heights of Women • Now, take 4 samples again … and one at a time – Use 1-Var Stats to get the mean . • Write that value on one of your post-it notes. • Repeat this 3 more times. • Place the notes upon the board CAREFULLY in the correct slots to build a histogram! • Let’s record the values in L2.
The Heights of Women • How did the “Empirical Rule” work out here? • Compare a Boxplot for L2 in PLOT 3 – to the one we did in PLOT 2 for the population. • What do the Shape, Center, and Spread look like for THIS NEW distribution? • Let’s look at the new SAMPLING DISTRIBUTION of Sample means of n = 100 histogram! • Conclusion: What is the relationship between the mean of the population and the mean of the X bars? What about the standard deviation of the population and that of the X-bars?
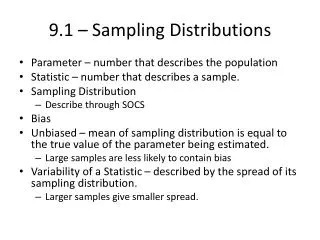
Terminology • Population Parameter- • Numerical value that describes a population • A “mysterious” and essentially unknowable – idealized value. • A theoretically fixed value • Ex: Population Mean, Population Standard Deviation, Population Proportion, Population Size
Terminology • Sample Statistic • Numerical value that describes a sample (a subset of a larger population) • An easily attainable and knowable value • Will vary from sample to sample • Used to estimate an unknown population parameter • Ex: Sample Mean, Sample Standard Deviation, Sample Proportion, Sample Size
Example and Exercises EXAMPLE 9.2: DO YOU BELIEVE IN GHOSTS? EXERCISE 9.4: WELL-FED RATS • EXAMPLE 9.1: MAKING MONEY EXERCISE 9.2: UNEMPLOYMENT
Sampling Variability • What would happen if we took many samples? • EXAMPLE 9.3 BAGGAGE LUGGAGE
Sampling Variability • Sampling Distribution: of a statistic is the distribution of values in ALL POSSIBLE samples of the same size • EXAMPLE 9.4 RANDOM DIGITS
Describing Sampling Distributions • EXAMPLE 9.5: ARE YOU A SURVIVOR FAN? 1000 SRSs; n = 100; p = 0.37 1000 SRSs; n = 1000; p = 0.37 Using the same x-axis scale as to the left! Using a scale to show shape!
UNBIASED vs. BIASED • A Statistic is said to be UNBIASED if the mean of the sampling distribution is equal to the true parameter being estimated • When finding the value of a sampling statistic, it is just as likely to fall above the population parameter as it is to fall below it.
VARIABILITY of a STATISTIC • The larger the sample size, the less variability there will be • EXAMPLE 9.6: THE STATISTICS HAVE SPOKEN • 95% of the samples generated: Mean ± 2 Sd • With n = 100 …0.37 ± 2 (0.05) = 0.37 ± 2 (0.05) • [0.32, 0.42] • With n = 1000 …0.37 ± 2 (0.01) = 0.37 ± 2 (0.01) • [0.35, 0.39] • The N-size is irrelevant! Accuracy for n = 2500 is the same for the entire 280M US, as it is for 775K in San Fran
BIAS & VARIABILITY (Revisited) Precision versus Accuracy
Homework Example • EXERCISE 9.9: BEARING DOWN • p = 0.1; 100 SRSs of size n = 200 • Non-conforming ball bearings out of 200 are shown: (e) What is we repeated this exercise, but instead used SRSs of size 1000 instead of 200? What would the mean of this be? Would the spread be larger, smaller or about the same as the histogram from part (a)? (c) Find the mean of the distribution of p-hat; mark it on the histogram. Any evidence of bias in the sample? (d) What is the mean of “the sampling distribution” of all possible samples of size 200? (b) Describe the shape of the distribution. • Make a table that shows the frequency of each count! Draw a histogram of the p-hat values.