Download
1 / 26
260 likes | 378 Views
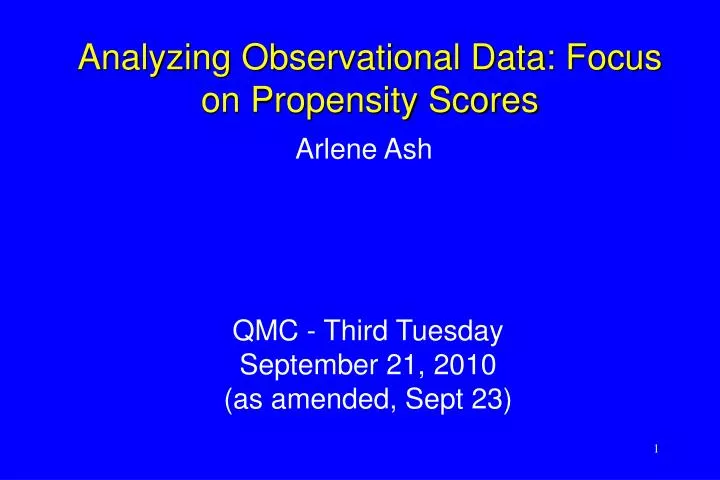
Analyzing Observational Data: Focus on Propensity Scores. Arlene Ash. QMC - Third Tuesday September 21, 2010 (as amended, Sept 23). The Problem. Those with the intervention and those without have markedly different values for important measured risk factors &

E N D
Analyzing Observational Data: Focus on Propensity Scores Arlene Ash QMC - Third Tuesday September 21, 2010 (as amended, Sept 23)
The Problem • Those with the intervention and those without have markedly different values for important measured risk factors & • Outcome is related to the risk factors that are imbalanced between the groups & • It is not clear how the risk factors and outcome are related • Why may standard analyses be misleading?
True and Modeled Relationship Between Risk and Outcome 1.0 0.8 0.6 Outcome 0.4 0.2 0 0 0.5 1.0 1.5 2.0 Risk
Is Imbalance in Risk a Problem? • If we correctly model the relationship between risk factors and outcome, we correctly estimate effect of the intervention • With many risk factors, hard to know if the relationship between risk factors and outcome is correctly modeled • Propensity score - a way to reduce the effect of imbalance in measured risk when models may be inadequate
Propensity Score Method (Key Idea) • The propensity score (PS) for an observation is the probability that the observation is “exposed” or “got the intervention” • Use the PS model in pre-processing the data • To draw a sub-sample where the exposed and non-exposed groups are fairly balanced on risk factors. Then • Use standard techniques to analyze the sub-sample
Simple Propensity Score Approach • Estimate a model to predict the “probability of intervention/exposure” • This is “the propensity score” • Divide the population into PS quintiles • Create a subsample by taking equal numbers of exposed and unexposed observations from each quintile • Use a subsequent regression model to estimate the effect of the intervention in the subsample
Propensity Score Sampling Example: Treatments for Drug Abusers • Patients seeking substance abuse detoxification in Boston receive either Residential detoxification Lasts ~ one week + encouragement for post-detox treatment, or Acupuncture Acute (daily) detox + 3-6 months of maintenance with acupuncture and motivational counseling
Data • From Boston’s publicly-funded substance abuse treatment system • All cases discharged from residential detox or acupuncture between 1/93 and 9/94 • Client classified (only once) as residential or acupuncture based on the modality of first discharge
Outcome • Is client re-admitted to detox within 6 months? (Y/N) • Study question: Are acupuncture clients more likely to be re-admitted than residential detoxclients? • Exposure = assigned to accupuncture
Client Characteristics Available At Time Of Admission • Living situation • Prior mental health • treatment • Primary drug • Substance abuse • treatment history • Gender • Race/ethnicity • Age • Education • Employment status • Income • Health insurance status
Gender: female 29 33 Race/ethnicity: black 46 46 Hispanic 12 10 White 41 43 Education: HS grad 56 59 College graduate 4 13 Residential Detox & Acupuncture Cases:% with Various Characteristics Residential Acupuncture Characteristic (n = 6,907) (n = 1,104)
Characteristics of Residential Detox & Acupuncture Clients (2) Residential Acupuncture Characteristic (n = 6,907) (n = 1,104) Employment: unemployed 86.8 43.2 Insurance: uninsured 52.3 65.4 Medicaid 28.2 21.2 3.0 15.4 Private insurance 9.5 19.3 Lives: with child 30.3 2.9 In shelter
Characteristics of Residential Detox & Acupuncture Clients (3) Residential Acupuncture (n = 6,907) (n = 1,104) Characteristic Prior mental health treatment 12.3 27.8 42.3 32.4 Primary drug: alcohol 16.2 Cocaine 16.6 Crack 15.9 20.2 Heroin 24.6 19.0
Characteristics of Residential Detox & Acupuncture Clients (4) Residential Acupuncture Characteristic (n = 6,907) (n = 1,104) Substance abuse admits in the last year Residential detox: 0 81.0 56.7 1 12.1 20.2 2+ 7.0 23.1 Short-term residential: 0 94.8 76.2 Long-term residential: 0 93.5 80.5 Outpatient: None 54.3 80.6 Acupuncture: None 90.1 95.9
Results Of Standard Analysis Percentage of clients re-admitted to detox within 6 months • Among 1,104 acupuncture cases, 18% re-admitted • Among 6,907 residential detox cases, 36% re-admitted • Raw odds ratio = 0.40 From a multivariable stepwise logistic regression model: • Odds ratio for acupuncture: 0.71 (CI = 0.53-0.95)
What’s the Worry? How Do We Address It? • Given how different the two groups are, can we trust a model to correctly estimate the effect of acupuncture? • PS methods generalize (long-standing) matching-within-strata methods that work well with 1 or 2 predictors • PS can address imbalances in many important predictors simultaneously • Both traditional and PS matching allow for • A pooled estimate (across all strata) or • When N is large enough, stratum-specific estimates
Propensity Score Application • Use stepwise logistic regression to build a model to predict whether a client “is exposed” (i.e., receives acupuncture) • Select sub-samples of exposed and non-exposed with similar distributions of the “propensity score” (predicted probability of being exposed) • Model (as before) on the sub-sample
Sampling Results • Able to match 740 who received acupuncture (out of 1,104) with 740 people who did not (out of 6,907) • The risk factors in this subsample of 1480 are much more balanced between the two groups
Characteristics of Clients in Subsample (vs. Full Sample) Residential Acupuncture Characteristic 7% 41% 9% 72% 5% 21% (4%) (13%) (3%) (55%) (30%) (12%) 7% 42% 6% 77% 4% 21% (13%) (57%) (15%) (76%) (3%) (28%) College graduate Employed Private Insurance Lives with child or adult Lives in shelter Prior mental health Rx
Comparing Standard and Propensity Score Findings From the multivariable model fit to all cases: Odds Ratio for acupuncture: 0.71 95% Confidence Interval: 0.53-0.95 From multivariable model fit to more comparable sub-sample: OR for acupuncture: 0.61 95% CI: 0.39-0.94
Summary • In this case, results were similar - Why? • Original model was very good (C-statistic = 0.96) • What we learned from the PS analysis: • Could find a subset of (about 10% of) patients who got residential detox who look very similar to those who got acupuncture • Skeptics were more receptive to findings from the PS analysis
Which X’s Belong in the PS Model? The goal is to estimate the effect of exposure E on outcome Y • Confounders (Brookhart’s X1 variables)? • Directly affect both E and Y • Simple predictors (X2 s)? • Affect Y but not E • Simple selectors (X3 s)? • Affect E but not Y
Example The goal is to estimate the effect of E = CABG surgery on Y = 30-day mortality following admission for a heart attack • Confounder (e.g., disease severity) • Simple predictors (e.g., home support) • Simple selectors, aka “instrumental variables” (e.g., random assignment)
Discussion • The “pre-processing” that occurs when sub-sampling to create “PS-balanced” comparison groups protects against bias from confounding variables • Putting selector variables in the PS model will hurt accuracy (by reducing the numbers of good matches) without making the groups more comparable • Subsequent regression improves accuracy