Download
1 / 44
460 likes | 660 Views
Understanding Network Failures in Data Centers. Michael Over. Questions to be Answered. Which devices/links are most unreliable? What causes failures? How do failures impact network traffic? How effective is network redundancy?

E N D
Understanding Network Failures in Data Centers Michael Over
Questions to be Answered • Which devices/links are most unreliable? • What causes failures? • How do failures impact network traffic? • How effective is network redundancy? • Questions will be answered using multiple data sources commonly collected by network operators.
Purpose of Study • Demand for dynamic scaling and benefits from economies of scale are driving the creation of mega data centers. • The data center networks need to be scalable, efficient, fault tolerant, and easy to manage. • The issue of reliability has not been addressed • In this paper, reliability is studied “by analyzing network error logs collected from over a year from thousands of network devices across tens of geographically distributed data centers.”
Goals of the Study • Characterize network failure patterns in data centers and understand overall reliability of the network • Leverage lessons learned from this study to guide the design of future data centers
Network Reliability • Network reliability is studied along three dimensions: • Characterizing the most failure prone network elements • Those that fail with high frequency or that incur high downtime • Estimating the impact of failures • Correlate event logs with recent network traffic observed on links involved in the event • Analyzing the effectiveness of network redundancy • Compare traffic on a per-link basis during failure events to traffic across all links in the network redundancy group where the failure occurred
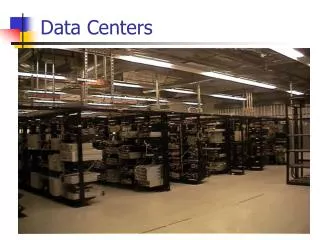
Data Sources • Multiple monitoring tools are put in place by network operators. • Static View • Router configuration files • Device procurement data • Dynamic View • SNMP polling • Syslog • Trouble tickets
Difficulties with Data Sources • Logs track low level network events and do not necessarily imply application performance impact or service outage • Separate failures that potentially impact network connectivity from high volume and noisy network logs • Analyzing the effectiveness of network redundancy requires correlating multiple data sources across redundant devices and links
Key Observations of Study • Data center networks show high reliability • More than four 9’s for 80% of the links and 60% of the devices • Low-cost, commodity switches such as ToRs and AggS are highly reliable • Top of Rack switches (ToRs) and aggregation switches (AggS) exhibit the highest reliability • Load balancers dominate in terms of failure occurrences with many short-lived software related faults • 1 in 5 load balancers exhibit a failure
Key Observations of Study • Failures have potential to cause loss of many small packets such as keep alive messages and ACKs • Most failures lose a large number of packets relative to the number of lost bytes • Network redundancy is only 40% effective in reducing the median impact of failure • Ideally, network redundancy should completely mask all failures from applications
Limitations of Study • Best effort: Possible missed events or multiply-logged events • Data cleaned, but some events may still be lost due to software faults or disconnections • Human bias may arise in failure annotations • Network errors do not always impact network traffic or service availability • Thus… failure rates in this study should not be interpreted as necessarily all impacting applications
Network Composition • ToRs are the most prevalent device type in the network comprising about 75% of devices • Load balancers are the next most prevalent at approximately 10% of devices • The remaining 15% are AggS, Core, and AccR • Despite ToRs being highly reliable, ToRs account for a large amount of downtime • LBs account for few devices but are extremely failure prone, making them a leading contributor of failures
Workload Characteristics • Large volume of short-lived latency-sensitive “mice” flows • Few long-lived throughput-sensitive “elephant” flows • There are higher utilization rates at upper layers of the topology as a result of aggregation and high bandwidth oversubscription
Methodology & Data Sets • Network Event Logs (SNMP/syslog) • Operators filter the logs and produce a smaller set of actionable events which are assigned to NOC tickets • NOC Tickets • Operators employ a ticketing system to track the resolution of issues • Network traffic data • Five minute averages of bytes/packets into and out of each network interface • Network topology data • Static snapshot of network
Defining and Identifying Failures • Network devices can send multiple notifications even though a link is operational • They monitor all logged “down” events for devices and links leading to two types of failures: • Link failures – connection between two devices is down • Device failures – device is not functioning for routing/forwarding traffic • Observe multiple components notifications related to a single high level failure or a correlated event • Correlate failure events with network traffic logs to filter failures with impact that potentially result in loss of traffic
Cleaning the Data • A single link or device may experience multiple “down” events simultaneously • These are grouped together • An element may experience another “down” event before the previous event has been resolved • These are also grouped together
Identifying Failures with Impact • Goal: Identify failures with impact without access to application monitoring logs • Cannot exactly quantify application impact such as throughput loss or increased response times • Therefore, estimate the impact of failures on network traffic • Correlate each link failure with traffic observed on the link in the recent past before the time of the failure • Traffic less than before the failure implies impact
Identifying Failures with Impact • For device failures, additional steps are taken to filter spurious messages • If a device is down, neighboring devices connected to it will observe failures on inter-connecting links. • Verify that at least one link failure with impact has been noted for links incident on the device • This significantly reduces the number of device failures observed
Failure Analysis • Links experience about an order of magnitude more failures than devices • Link failures are variable and bursty • Device failures are usually caused by maintenance
Probability of Failure • Top of Rack switches (ToRs) have the lowest failure rates • Load balancers (LBs) have the highest failure rate
Grouping Link Failures • In order to correlate multiple link failures: • The link failures must occur in the same data center • The failures must occur within some predefined time threshold • Observed that link failures tend to be isolated
Estimating Failure Impact • In the absence of application performance data, they estimate the amount of traffic that would have been routed on a failed link had it been available for the duration of a failure • The amount of data that was potentially lost during a failure event is estimated as: • Loss = (medb – medd) x duration • Link failures incur loss of many packets, but relatively few bytes • Suggests packets lost during failures are mostly keep alive packets used by applications
Is Redundancy Effective? • There are several reasons why redundancy may not be 100% effective: • Bugs in fail-over mechanisms can arise if there is an uncertainty as to which link or component is the backup • If the redundant components are not configured correctly, they will not be able to re-route traffic away from the failed component • Protocol issues such as TCP backoff, timeouts, and spanning tree reconfigurations may result in loss of traffic
Redundancy at Different Layers • Links highest in the topology benefit most from redundancy • A reliable network core is critical to traffic flow • Redundancy is effective at reducing failure impact • Links from ToRs to aggregation switches benefit the least from redundancy, but have low failure impact • However, on a per link basis, these links do not experience significant impact from failures so there is less room for redundancy to benefit them
Discussion • Low end switches exhibit high reliability • Improve reliability of middleboxes • Improve the effectiveness of network redundancy
Related Work • Application failures • Netmedic aims to diagnose application failures in enterprise networks • Network failures • These studies also observed that the majority of failures in data centers are isolated • Failures in cloud computing • Increased focus on understanding component failures
Conclusions • Large-scale analysis of network failure events in data centers • Characterize failures of network links and devices • Estimate failure impact • Analyze effectiveness of network redundancy in masking failures • Methodology of correlating network traffic logs with logs of actionable events to filter spurious notifications
Conclusions • Commodity switches exhibit high reliability • Middle boxes need to be better managed • Effectiveness of redundancy at network and application layers needs further investigation
Future Work • This study considered the occurrence of interface level failures – only one aspect of reliability in data center networks • Future: Correlate logs from application-level monitors • Understand what fraction of application failures can be attributed to network failures.