Download
1 / 42
420 likes | 628 Views
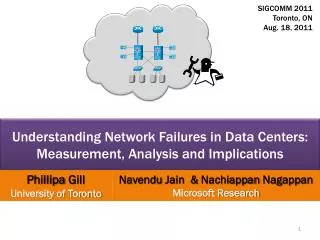
Understanding Network Failures in Data Centers : Measurement, Analysis, and Implications. Group Research 1 : AKHTAR, Kamran SU, Hao SUN, Qiang TANG, Yue YANG, Xiaofan

E N D
Understanding Network Failures in Data Centers:Measurement, Analysis, and Implications Group Research 1: AKHTAR, Kamran SU, Hao SUN, Qiang TANG, Yue YANG, Xiaofan (42 slides)
Summary This is the first large-scale analysis of failures in a data center network. Based on data center networks and characterizing failure events within data center, using multiple data sources commonly collected by network operators, analyze and estimating the failures, their impact, and the effectiveness of network redundancy. Key achievements: They found that commodity switches exhibit high reliability which supports current proposals to design flat networks using commodity components. They also highlighted the importance of studies to better manage middle boxes such as load balancers, as they exhibit high failure rates. Finally, at both network and application layers, more investigation is needed to analyze and improve the effectiveness of redundancy.
OUTLINE Part 1: Introduction Part 2: Background Part 3: Methodology and Data Sets Part 4: Failure Analysis Part 5: Estimating Failure Impact Part 6: Discussion Part 7: Related Work Part 8: Conclusions and Future Work
F C A P S Fault management
Data Center Networks scalable, efficient, fault tolerant, and easy-to-manage
Three dimensions Characterizing the most failure prone network elements Estimating the impact of failures. 3. Analyzing the effectiveness of network redundancy
3.1 Existing data sets 1. Network event logs (SNMP/syslog) 2. NOC Tickets Info about when and how events were discovered as well as when they were resolved (operators employ it) 3. Network traffic data 4. Network topology data
“provisioning” (no data before, some data transferred during failure) 3.2---3.4 Defining and identifying failures with impact Link failures Device failures
For link failures Eliminating spurious notifications Focus on measurable events For device failures At least one link failure within a time window of five minutes We only need failure events impacted network traffic
Outline Failure event panorama Daily volume of failures Probability of failure Aggregate impact of failures Properties of failures Grouping link failures Root causes of failures
Failure event panorama All failures vs. failures with impact Widespread failures Long-lived failures
Daily volume of failures Link failures are variable and bursty Device failures are usually caused by maintenance Table4: Failures per time unit
Probability of failure Load balancers have the highest failure probability ToRs have low failure rates Load balancer links have the highest rate of logged failures Management and inter-data center links have lowest failure
Aggregate impact of failures Load balancers have the most failures but ToRs have the most downtime Load balancer links experience many failure events but relatively small downtime Load balancer failures dominated by few failure prone devices
properties of failures • Time to repair • Load balancers experience short-lived failure • ToRs experience correlated failures • Inter-data center links take the longest to repair
properties of failures • Time between failures • Load balancer failures are bursty • Link flapping is absent from the actionable network logs • MGMT, CORE and ISC links are the most reliable in time between failures
properties of failures • Reliability of network elements • Data center networks experience high availability • Links have high availability (having higher than 9’s of reliability)
Grouping link failures • To group correlated failures • Require that link failures occur in the same data center • Failures to occur within a predefined time threshold • Link failures tend to be isolated
Root causes of failures Choose to leverage the “Problem type” field of the NOC tickets Hardware problems take longer to mitigate Load balancers affected by software problems Link failures are dominated by connection and hardware problems
5.1 Is redundancy effective in reducing impact? Several reasons why redundancy may not be 100% effective: 1. bugs in fail-over mechanisms can arise if there is uncertainty as to which link or component is the back up. 2. if the redundant components are not configured correctly, they will not be able to reroute traffic away from the failed component. 3. protocol issues such as TCP backoff, timeouts, and spanning tree reconfigurations may result in loss of traffic. Network redundancy helps, but it is not entirely effective.
5.2 Redundancy at different layers of the network topology Links highest in the topology benefit most from redundancy. Links from ToRs to aggregation switches benefit the least from redundancy, but have low failure impact.
Low-end switches exhibit high reliability Low-cost The lowest failure rate with a lower failure probability However, as populations of these devices rise, the absolute number of failures observed will inevitably increase.
Improve reliability of middle-boxes Need to be taken into account The development of better management and debugging tools Software load balancers running on commodity servers Load balancer links have the highest rate of logged failures Management and inter-data center links have lowest failure
Improve the effectiveness of network redundancy Network redundancies in our system are 40% effective at masking the impact of network failures. One cause: due to configuration issues that lead to redundancy being ineffective at masking failure The back up link was subject to the same flaw as the primary.
Separate control plane from data plane The separation between control plane and data plane becomes even more crucial to avoid impact to hosted applications. The cases of NOC tickets
Application failures Other study [1] found: The majority of failures occur during the TCP handshake as a result of end-toend connectivity issues. Web access failures are dominated by server-side issues. These findings highlight the importance of studying failures in data centers hosting Web services.
Network failures Some studies observe significant instability and flapping as a result of external routing protocols [2]. Unlikethese studies, not observe link flapping owing to our data sources being geared towards actionable events. Some studies find that 70% of failures involve only a single link [3]. Similarly observe that the majority of failures in data centers are isolated. Some studies also observe longer time to repair on wide area links [4]. Similar to the observations for wide area links connecting data centers.
Failures in cloud computing Some studies consider the availability of distributed storage and observe that the majority of failures involving more than ten storage nodes are localized within a single rack [5]. Also observe spatial correlations but they occur higher in the network topology, where we see multiple ToRs associated with the same aggregation switch having correlated failures.
Give your own opinionabout what you think is good or bad about the paper, e.g. how could it be improved?
References [1] V. Padmanabhan, S. Ramabhadran, S. Agarwal, and J. Padhye. A study of end-to-end web access failures. In CoNEXT, 2006. [2] B. Schroeder, E. Pinheiro, and W.-D. Weber. DRAM errors in the wild: A large-scale field study. In SIGMETRICS, 2009. [3] A. Shaikh, C. Isett, A. Greenberg, M. Roughan, and J. Gottlieb. A case study of OSPF behavior in a large enterprise network. In ACM IMW, 2002. [4] D. Turner, K. Levchenko, A. C. Snoeren, and S. Savage. California fault lines: Understanding the causes and impact of network failures. In SIGCOMM, 2010. [5] K. V. Vishwanath and N. Nagappan. Characterizing cloud computing hardware reliability. In Symposium on Cloud Computing (SOCC), 2010. The figures come from the project paper, Understanding Network Failures in Data Centers: Measurement, Analysis, and Implications.