Download
1 / 10
100 likes | 175 Views
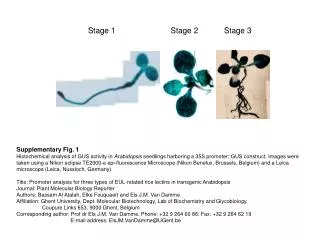
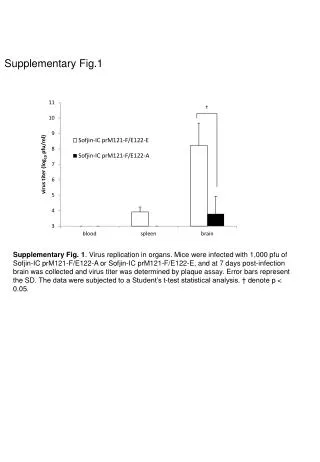
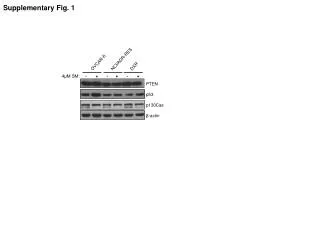
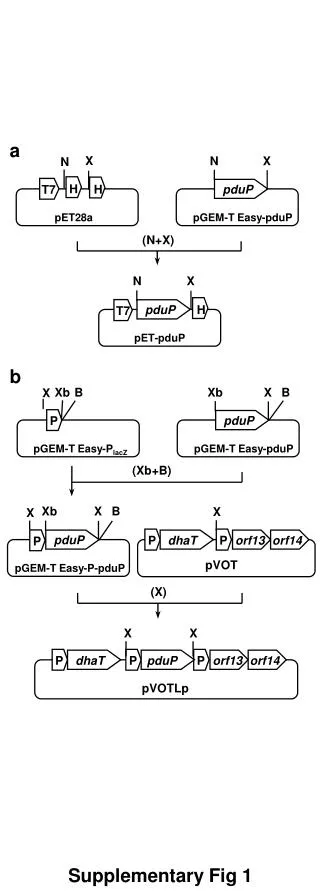
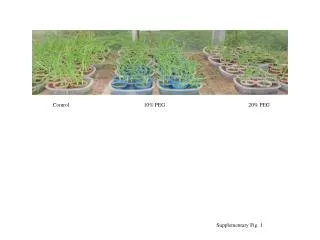
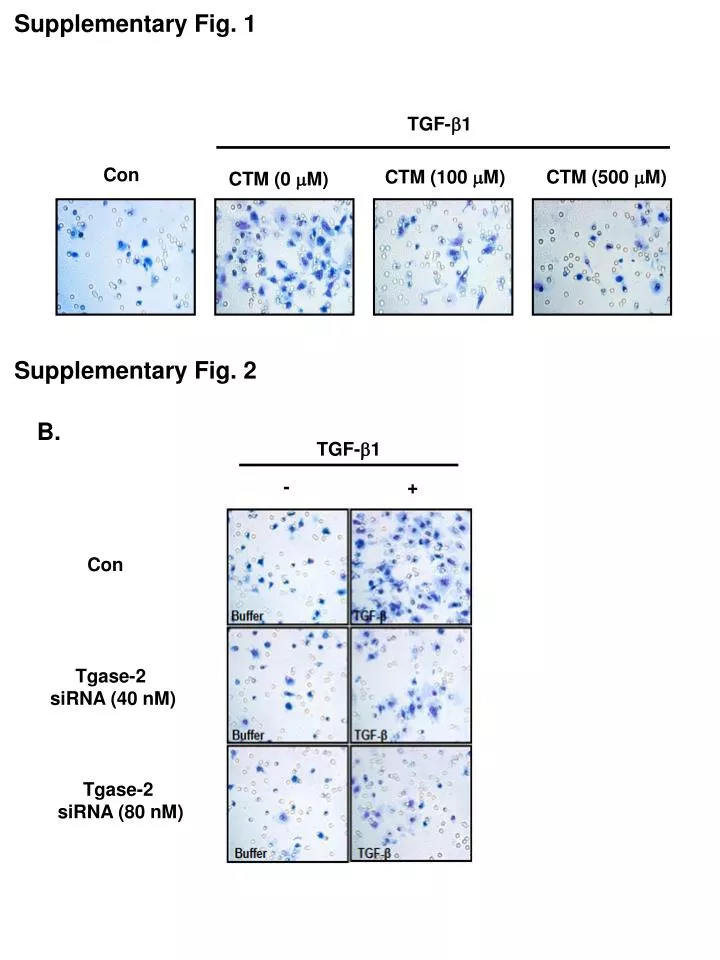
Supplementary Fig. 1. TGF- b 1. Con. CTM (100 m M ). CTM (500 m M ). CTM (0 m M ). Supplementary Fig. 2. B. TGF- b 1. -. +. Con. Tgase-2 siRNA (40 nM ). Tgase-2 siRNA (80 nM ). Supplementary Fig. 3. CTM ( m M ). 0. Control. 100. 500. 1000. TGF- b 1 (100 pM ).

E N D
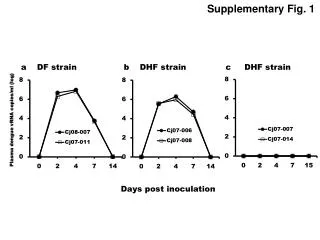
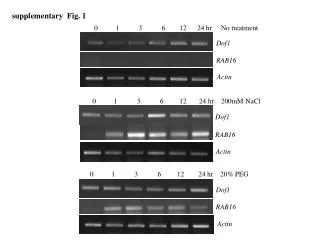
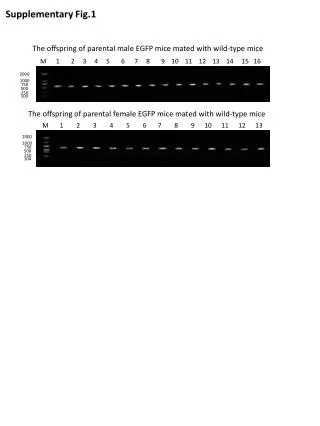
Supplementary Fig. 1 TGF-b1 Con CTM (100 mM) CTM (500 mM) CTM (0 mM) Supplementary Fig. 2 B. TGF-b1 - + Con Tgase-2 siRNA (40 nM) Tgase-2 siRNA (80 nM)
Supplementary Fig. 3 CTM (mM) 0 Control 100 500 1000 TGF-b1 (100 pM) Supplementary Fig. 4 Control TGF-b1 Mock Control TGF-b1 Control TGF-b1 Tgase2 siRNA40nM Tgase2 siRNA80nM
Supplementary Fig. 5 Control TGF-b1 Control TGF-b1 Control TGF-b1 Mock N-cad (2) siRNA 40nM N-cad (2) siRNA 80nM Supplementary Fig. 6 Ncad(2) siRNA (nM) Mock Con 40 80 TGF-β1 - +- + - + N-Cad β-actin
Supplementary Fig. 7 A549WT Control TGF-b mock Control TGF-b A549TG2 JNK1 siRNA(nM) Control 40 80 160
Supplementary Fig. 8 A549WT JNK2 siRNA Control TGF-b mock Control TGF-b A549TG2 JNK2 siRNA(nM) Control 40 80 160
Supplementary Fig. 9 Con TGF-b1 Supplementary Fig. 10 Cell proliferation (%) TGF-b1 (pM) Supplementary Fig. 11 Supplementary Fig. 12 TGF-b1 (100 pM) TGF-b1 (pM), 48 h 0 50 100 200 500 0 2 5 15 24 48 h E-Cad E-Cad N-Cad N-Cad Tgase2 Tgase2 β-actin β-actin
Supplementary Fig. 13 TGF-β1 TGF-β1 Con Con DAPI E-Cad N-Cad Supplementary Fig. 14 Control TGF-b1 H838 H1299 H1703 H838 H1299 H1703 N-Cad Tgase-2 pJNK PP2A β-actin
Supplementary Fig. 15 * *P<0.05 compared with Con(-) # # #P<0.05 compared with Con(+) Migration (fold) - + - + - + TGF-b1 (100 pM) Con Mock 40 80 N-cad siRNA (nM) Control TGF-b1 Control TGF-b1 Control TGF-b1 Mock N-cad siRNA 40nM N-cad siRNA80nM
Supplementary Fig. 16 * Invasion (fold) * * * * Con TGF-b1 Mock Con TGF-b1 Con 40 80 160 JNK1 siRNA JNK1 siRNA(nM) A549WT A549TG2 A549WT JNK1 siRNA Control TGF-b mock Control TGF-b A549TG2 JNK1 siRNA(nM) Control 40 80 160
Supplementary Fig. 17 * * * Invasion (fold) * * Con TGF-b1 Mock Con TGF-b1 Con 40 80 160 JNK2 siRNA JNK2 siRNA(nM) A549WT A549TG2 A549WT JNK2 siRNA Control TGF-b mock Control TGF-b A549TG2 JNK2 siRNA(nM) Control 40 80 160