Download
1 / 33
330 likes | 412 Views
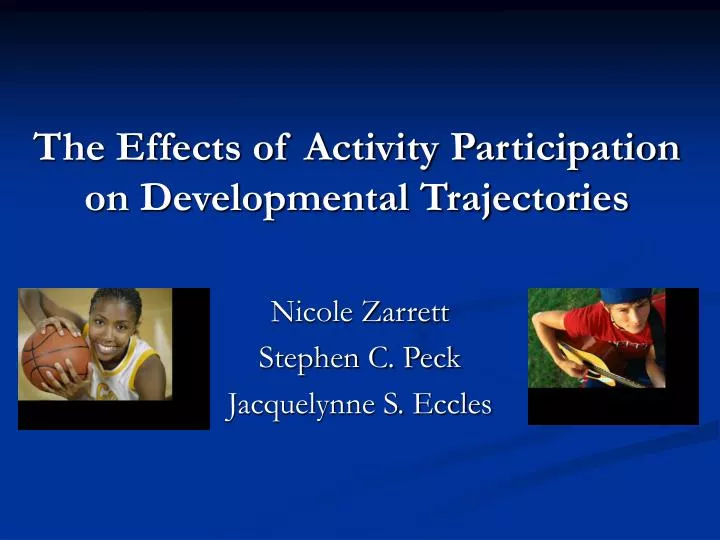
The Effects of Activity Participation on Developmental Trajectories. Nicole Zarrett Stephen C. Peck Jacquelynne S. Eccles. Positive Youth Outcomes. Academic Performance and Engagement (Bartko et al., 2000; Marsh, 1992; Lamborn et al, 1992) Reduced rates of school dropout

E N D
The Effects of Activity Participation on Developmental Trajectories Nicole Zarrett Stephen C. Peck Jacquelynne S. Eccles
Positive Youth Outcomes • Academic Performance and Engagement (Bartko et al., 2000; Marsh, 1992; Lamborn et al, 1992) • Reduced rates of school dropout (Mahoney and Cairns, 1997) • Self-concept (Barber and Eccles, 1999) • Civic engagement (Youniss, et al, 1997) • Psychological health (Barber et al, 2001; Larson & Kleiber, 1993) • Reduced Delinquency/criminality (Mahoney, 1997; Yin et al, 1999)
Sport Participation Outcomes • Higher Academic Performance in H.S. • Greater Likelihood of Attending College • Physical and Mental Health • Greater Autonomy and Satisfaction in First Job • Social Well Being • A Variety of Skills • Teamwork, self-discipline, leadership and socialization *See Eccles, Barber and Stone (2001); U.S Dept. of Health and Human Services (2000)
Sport Participation Outcomes • Greater use of alcohol, binge drinking and getting drunk • (Harrison et al., 2003; Eccles et al., 2001) • Greater use of smokeless tobacco and steroids • (Grunbaum et al, 2002; Garry et al., 2000; Harrison et al., 2003) • Other “risky” behaviors such as truancy • (Eccles et al., 2001) (Lower use of cigarettes, marijuana, cocaine and “other drugs”) • Baumert et al., 1998; Melnick et al., 2001; Page et al., 1998
Variable-Centered Approach • Previous Research • Specific focus on one activity context • Sum score of extracurricular participation Pattern-Centered Approach • Multiple Activity Settings • Both Constructive and Passive Activities • Cooper et al., (1999) • Shanahan & Flaherty (2001) • Bartko and Eccles (2003)
Research Hypotheses • Youth in the Sports Activity patterns will report: • Higher academic achievement • Higher rates of alcohol use • Differences between the Sport-Dominant Activity patterns • Sports+Act(s) = highest academic achievement • Sports-only = highest alcohol use • Continuity of Sports participation • Basic Model: Sports, Low Engaged, Others • Multi-Sport Model: Sport-only, Sport+Act(s), Low Engaged, Others
Maryland Adolescent Development in Context Study (MADICS) (PI’s J. Eccles and A. Sameroff) • A community-based longitudinal study • 7th, 9th, and 11th grades, 1 and 3 yrs post H.S. • 1,482 adolescents and their families • 49% female • 61% African American, 35% White • Pretax family income in 1990: • Mean: 42,500-52,500 / Range: 5, 000-75,000 • Income normatively distributed among both African Americans and Whites.
Analyses • Youth Activity Patterns • Cluster analysis using Sleipner 2.0 Package • 7th, 9th,and 11th grade • Participation Continuity • Beginning in the 7th/9th and continuing through 11th grade • Comparisons • Univariate Analyses with Planned Contrasts
MeasuresYouth Activities • Constructive Activities • Sports, School-related, Community, Volunteer and Religious activities. • Reading, Homework, Work, Chores and playing a Musical Instrument. • Passive Activities • Hanging out with Friends and Watching Television Activities were measured on a scale of 1 thru 5 (1=little to no involvement in the activity 5=participate daily)
Measures continued… Academic Achievement • Grade Point Averages (7th, 9th,and 11th Grades) • How far youth is expected to go in school • (1=LE 11thgrade; 6=Bachelor’s Degree; 8=MD, Law, Ph.D) • Actual Educational Attainment (1-3years post-H.S.) • (1=Attrition; 2=Dropout of H.S.; 3=H.S. Diploma/No College; 4=H.S. Diploma and College) Alcohol Use • How often youth had an alcoholic beverage(s) in the past 6 months • (0=none; 1=rarely; 2=2-3times a month; 3=GE 1/week)
7th Grade Achievement: Cross Sectional • Sport group differences [F(1, 903)=7.43 p=.007] ** Mean of GPA ** *Net of the effects of Prior Achievement and Socioeconomic Status *No interaction effects with youth’s race or gender
9th Grade Achievement: Cross Sectional Difference between Groups: [F(3, 695)=3.01, p=.03] ** * Mean of GPA *Net of the effects of Prior Achievement and Socioeconomic Status *No interaction effects with youth’s race or gender
11th Grade Achievement: Cross Sectional • Difference Between Groups: F(6, 660)=2.48, p=.003] *** Mean of GPA *Net of the effects of Prior Achievement and Socioeconomic Status *No interaction effects with youth race or gender
11th Grade Achievement: Cross Sectional • Difference Between Groups: F(6, 660)=2.48, p=.003] *** Mean of GPA *Net of the effects of Prior Achievement and Socioeconomic Status *No interaction effects with youth’s race or gender
11th Grade Achievement: Cross Sectional • Spt Groups Differences: F(1, 660)=3.46, p=.06] *** *** Mean of GPA *Net of the effects of Prior Achievement and Socioeconomic Status *No interaction effects with youth’s race or gender
11th Grade Achievement: Cross Sectional • Difference Between Groups: F(6, 660)=2.48, p=.003] *** Mean of GPA * *Net of the effects of Prior Achievement and Socioeconomic Status *No interaction effects with youth’s race or gender
Participation Continuity • BASIC MODEL • Sports, Low Engaged, and Others • MULTI-SPORT MODEL • Sport-Only (n=41 ) • Sport+Act(s) (n=35) • Hoppers (n=33) • Low Engaged (n=45) • Others (n=515)
Continuity of Participation: Basic Model 11th Grade Educational Expectations Difference between groups: [F(2, 379)=7.93, p=.000] *** Mean of Ed Expect *Net of the effects of Prior Achievement and Socioeconomic Status *No interaction effects with youth race or gender
Educational Attainment: 1-3yrs Post-H.S. • Difference Between Groups: [F(2, 417)=7.82, p=.000] *** Mean of Ed Attain *Net of the effects of Prior Achievement and Socioeconomic Status *No interaction effects with youth race or gender
Alcohol Use: Cross Sectional Results 7th Grade • No Difference Between Groups 9th Grade • No Difference Between Groups 11th Grade • Group Differences by Activity Pattern • [F(6, 769)=2.58, p=.01] *Net of the effects of Prior Achievement and Socioeconomic Status *No interaction effects with youth’s race or gender
Alcohol Consumption: Cross Sectional Sport Group Differences: * ** *** *Net of the effects of Prior Achievement and Socioeconomic Status *No interaction effects with youth race or gender
Alcohol Consumption: Cross Sectional Sport Group Differences: *** *** *** *Net of the effects of Prior Achievement and Socioeconomic Status *No interaction effects with youth race or gender
Alcohol ConsumptionContinuity of Participation Basic Participation Continuity Model • NO DIFFERENCES Multi-Sport Group Continuity Model • Differences between groups
Alcohol Use By Activity Participation Continuity * * Mean of Alcohol Use *Net of the effects of Prior Achievement and Socioeconomic Status *No interaction effects with youth race or gender
Summary • Youth Activities occur in multiple contexts • Different Influence on developmental outcomes • Academically: Sports beneficial for youth • Differences between sports groups • Alcohol Use: • Sport-only an at-risk group • Sports+Act(s) is beneficial for youth
Thank you. For more information: www.rcgd.isr.umich.edu/garp/