Download
1 / 25
250 likes | 447 Views
Web Analytics Best Practices. Kevin Murphy NASA ESDIS. Web Analytics in Context. Tools primarily developed for commerce use Adapt commercial practices to improve our users experiences and increase usage Government privacy and IT policy limit what technologies we can utilize.

E N D
Web Analytics Best Practices Kevin Murphy NASA ESDIS
Web Analytics in Context • Tools primarily developed for commerce use • Adapt commercial practices to improve our users experiences and increase usage • Government privacy and IT policy limit what technologies we can utilize
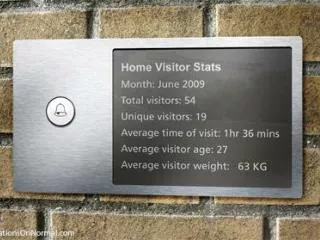
What is Web Analytics • The assessment of a variety of data to help create a generalized understand of the visitor online experience (Source: Web Analytics Demystified) • Monitoring and making the necessary improvements to make the visitor’s experience better • Quantitative: Web traffic, web based transactions • Qualitative: Surveys, Usability Studies, User submitted information, etc.
Components of a SuccessfulWeb Analytics Strategy • Customer first mentality • Define actionable business questions • Design metric capturing methodology • Implement and verify metric gathering • Measuring performance • Communicate actionable results • Rinse repeat Business Questions Metric Capture Methodology Implement and Verify Measure Performance Communicate Results
Customer Centricity How is the website doing in terms of delivering for the customer? Outcome Metrics Outreach Impacts Trending A/B Testing Visit Duration Conversion Rate Bounce Rates Download Rate
Business Questions • Open-ended and at a high-level. • Likely require you to go outside your current systems and sources to look for data and guidance in order to measure successes. • Rarely include columns and rows into which data is plunked.
Examples • What are the top five problems users experience on our website? • What is the most influential content on our website? • What is the impact of the website on user services? • What are the most productive inbound traffic streams? Which sources are missing?
Metric Capturing Methodology • Methodology based on business questions • Lots of data to waste time on • Start simple and progress to complexity • Gain confidence in data and method • Create actionable insights and metrics • Actively define, refine and test your hypothesis Click Stream (Web Metrics) Segmentation Behavior Data Driven Decisions Experience Outcomes Research Testing (A/B, Multivariate) Survey Errors/Problems Downloads Content/Service
Methodology • Ensure you can tie data together Behavior User_id Session_id Test_value Site_id User_id Session_id Tracking_code Data Driven Decisions Experience Outcomes User_id Session_ID
Note on RIA Rich Internet Applications (RIA) • Technologies include ajax, flash, rss, blogs, adobe • Requires planning upfront, during the design phase of the tool • Identify core events and use them as key metrics • Science data download • Invoke online subsetter • Task completion rate (funnel reports) • Tracking Methods • Page tagging using JavaScript • Event tagging • Custom hooks • Custom logs for integration between EMS HTMLDB and NetInsight • Are you currently using RSS? Feedburner • Metrics • Publishing content more people are interested in (subscribers) • What type of content causes people to come back and consume content • Number of times links that are published via RSS draw people back.
Avoid the Data Quality Trap • Web metric data are dirty • People do crazy things on the web • There will never be reconciliation between different tools • Lack of cookies limit our ability to track. – the policy could change. comments? • Proxies, multiple computers • So how do you make decisions, believe in the data?
Decisions and Data Quality • Start simple • Goals are important • Trending provides one context • Testing will tell you if you are doing the right thing • Communicate what you know
Implementing and Verifying Metrics Click Stream Segmentation Key Metrics • Plan and understand • Page tag implementation guide, contact EMS, consult online resources • Sometimes you need more than one metric collection method • Linking between NetInsight and HTMLDB is available • ACSI/Custom survey Behavior To influence optimal Behavior Understand Users Experience Data Driven Decisions Experience Outcomes Research Customer Satisfaction A/B Testing Heuristic Evaluations Orders Conversion Rates Problem Resolution Nuances of Outcome
Implementation Best Practices • Tag all pages • Create specific error tags (Not Found, Technical, ect…) • Make sure tags go last • Just before </BODY> • Tags should be inline not embedded • Identify unique page definition (mostly for dynamic pages) • Tag product downloads with event tags • PDFs, Binary files • Consider link-coding issues • Be aware of redirects • Validate data is being captured correctly • Correctly encode rich media
Measuring Performance • Data Needs Context • Data Exploration • Charts/Visualizations • Segmentation • Experimentation and Testing • A/B; A/B/C; A/B/A (look testing) • Multivariate (zone testing) • Lots more…
Key Metric Concepts • Visits • Segmentation • New vs. Returning Visitors • Visit Duration vs. Content Type • Geographic Location vs. Content Type • Engagement • Categorical (high, med, low) • IDs and tracking codes on your pages
Key Metrics • General • Views • Visits • Bounce Rate • Conversion Rate • Time on Site • New vs. Returning Visitors • Depth of Visit • Non Commerce Sites • Loyalty • How much content is consumed • Engagement of web applications (RIA)
Potential Pitfalls • One page view (Bounced Visitors) • Exclude these from your reports • Time on last page • Inaccurate calculation • Averages hide behavior • Segment your visits
Communicating Results • Dashboards are important but don’t overload • Send the right reports to the right people (documentation, applications, user services) • Provide context for reports and make recommendations, don’t just deliver reports • Work with EMS to automate creation and delivery of reports
Reporting Best Practices • Provide a caption explaining the chart. • Label charts with the type of information contained (e.g. Provisional or Official metrics). • Specify any filters or assumptions used in chart creation in a notes section or appendix. • Include the creation date for the report. • Identify the source of metrics (e.g. EMS or other source). • Create an archive of reports for future comparison.
Three Fundamental Truths • Being successful with web analytics is relatively easy • Recognize three truths • Web analytic applications are not easy for everyone to use • Most people underestimate what it takes • Web data is not easily to interpreted by everyone • Web analytics is a process • AMA Online Seminar, March 6, 2007
Visitors Behavior • What pages they navigate through, and the amount of time they spend on each of these pages • Identifying the navigational bottlenecks and then eliminating them leading to a more satisfied user.
Improve conversion rates • How many people are doing a specific action. • Provides information on which traffic is most likely to convert • How can I better target outreach? • Look at different outreach methods
References and Useful Resources • “Web Metrics: Proven Methods for Measuring Web Site Success” Jim Sterne • “Web Analytics Demystified” Eric Peterson • Web Analytics-An Hour a Day” Avinash Kaushik