Download
1 / 38
490 likes | 793 Views
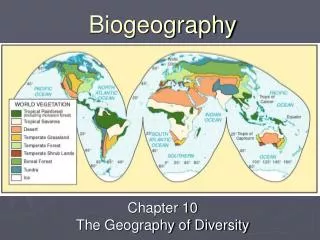
Biogeography. Chapter 11 History of Lineages and Biotas. Figure 11.1 A hypothetical phylogeny, the only illustration Darwin included in The Origin of Species. 11.2 An evolutionary classification and reconstructed phylogeny of living vertebrates. Agnatha – A class of jawless fish

E N D
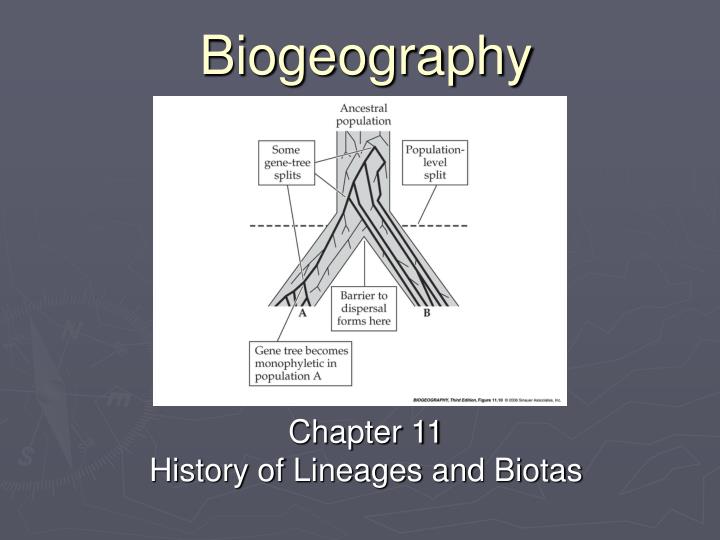
Biogeography Chapter 11History of Lineages and Biotas
Figure 11.1 A hypothetical phylogeny, the only illustration Darwin included in The Origin of Species
11.2 An evolutionary classification and reconstructed phylogeny of living vertebrates Agnatha – A class of jawless fish Placodermi – Jawless fish with boney protective plates Chondrichthyes – Cartilaginous fish Osteichthyes – Boney fish Aves - Birds
Molecular Clocks • Molecular biologists can use an estimated constant rate of evolution for proteins and DNA to determine the history of lineages. • Still a controversial technique • Calibrated from known fossil record • Tested against other lines of evidence • Can be used as a model for when to search for important fossils.
11.8 Diagnostic fossils and rates of molecular divergence demonstrate that divergence from a common ancestor happened 310 million years ago
11.8 Diagnostic fossils and rates of molecular divergence. Developing a model to examine the rates of molecular divergence
11.9 Phylogeny and estimated divergence times of 12 known linyphiid spiders on the Hawaiian Islands
Phylogeography • Systematics – The study of the evolutionary relationships between organisms • Monophyletic – A group of organisms that include an ancestral taxon and all of its descendents • Paraphyletic – A group that includes an ancestral taxon and some but not all of its descendents • Polyphyletic – A grouping different from above that is an artificial taxon • Clade – A monophyletic evolutionary branch
Figure 11.11 Phylogeography as a bridge between traditionally separate concerns of microevolution
Oldest known bat fossil (Icaronycteris index) from the Green River Shale in Wyoming at about 50 Million Years BP
11.17 Estimated area of potentially fossil-bearing sedimentary geological strata of varying ages
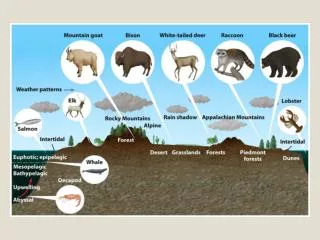
Paleoecology • Fossils can be used as mileposts along the path of evolution • Provides a temporal perspective to the changes ecological systems • Geological provenance can tell us about past environments
11.19 Fossil localities of camels (family Camelidae) from the Pleistocene in western North America
11.20 Information from the fossil record is essential for interpreting biogeographic history with this example of lungfishes (Lepidoseriformes)
11.21 Distribution of limestone, indicating past location of shallow marine waters and coral reefs
11.22 (A) Geographic distribution, and (B) mtDNA phylogeny for a group of closely related species of leaf-eared mouse (Part 1)
11.22 (A) Geographic distribution, and (B) mtDNA phylogeny for a group of closely related species of leaf-eared mouse (Part 2)
11.17 Estimated volume of potentially fossil-bearing sedimentary geological strata of varying ages
11.3 A cladogram showing nested monophyletic groups within the Vertebrata
11.4 Cladograms illustrating monophyletic, paraphyletic, and polyphyletic groups (Part 1)
11.4 Cladograms illustrating monophyletic, paraphyletic, and polyphyletic groups (Part 2)
11.4 Cladograms illustrating monophyletic, paraphyletic, and polyphyletic groups (Part 3)
11.5 Simple phylogenetic tree illustrating the concepts of ingroup, outgroups, and sister group
11.6 Morphological phylogeny placing 66–68 million-year old fossil bird Vegavis iiai in the waterfowl
11.7 An illustration of the hierarchical nature of phylogeny
11.12 Illustration of five possible categories of phylogeographic pattern (Part 1)
11.12 Illustration of five possible categories of phylogeographic pattern (Part 2)
11.13 Mitochondrial DNA phylogenetic tree for mtDNA haplotypes of the Tailed frog (Part 1)
11.13 Mitochondrial DNA phylogenetic tree for mtDNA haplotypes of the Tailed frog (Part 2)
11.14 Unrooted haplotype networks within and among three species of elephant
11.15 A gene tree that differs from the “true” phylogenetic relationships among species
11.16 A phylogenetic hypothesis for the family-level relationships and evolutionary history of South American marsupials