Download
1 / 36
360 likes | 483 Views
Regulation since the Crisis: What has changed and is it enough?. Howard Davies Director, LSE. ICEF Seminar HSE Cultural Centre 29 November 2010. Global Regulatory Architecture European Regulatory Architecture Basel 3 Derivatives Bankers’ Pay Governance. Six Topics.

E N D
Regulation since the Crisis: What has changed and is it enough? Howard Davies Director, LSE ICEF Seminar HSE Cultural Centre 29 November 2010
Global Regulatory Architecture European Regulatory Architecture Basel 3 Derivatives Bankers’ Pay Governance Six Topics
Complexity Built on the old three-sector model Unrepresentative membership US dominance No single European voice No authority or hierarchy Six Problems with the System
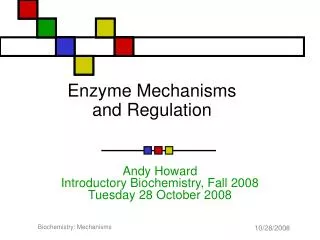
EU: Pre-Crisis FSC Financial Services Committee EFC Economic and Financial Committee Council of Ministers (ECOFIN) European Parliament European Commission Council Working Groups (legislative) CoRePer Ambassadors (legislative) Government Level (Finance Ministries + Observers from regulatory level) ARC Accounting Regulatory Committee EIOPC European Insurance and Occupational Pensions Committee EBC European Banking Committee EFCC European Financial Conglomerates Committee AURC Audit Regulatory Committee ESC European Securities Committee Regulatory Level (Competent Authorities) CESR Committee of European Securities Supervisors CEIOPS Committee of European Insurance and Occupational Pension Supervisors CEBS Committee of European Banking Supervisors IWCFC Interim Working Committee on Financial Conglomerates EGAOB European Group of Audit Oversight Bodies 3L3 Committee ECB Banking Supervision Committee of the ECB Central Bank Level Outside Commission Committee Framework
European Systemic Risk Board (ESRB) (Chaired by President ECB) Members of ECB/ESCB General Council Chairs of EBA, EIA & ESMA European Commission + + Information on micro-prudential developments Early risk warning European System of Financial Supervision (ESFS) European Banking Authority (EBA) European Insurance Authority (EIA) European Securities and Markets Authority (ESMA) National Banking Supervisors National Insurance Supervisors National Securities Supervisors EU: Post-Crisis Macro-prudential supervision Micro-prudential supervision Source: De Larosière Report, February 2009.
A more representative but (probably) less effective overarching body with highly diverse views The same complexity below A little more discipline in the system through the FSB, but with no new powers A partial European reform Weakened US leadership, but no replacement for it So now we have
The charge: The response: Banks were allowed to operate with too little capital. Leverage grew, and revenues were inadequate to cover losses when asset prices fell. ‘Basel 3’ will triple capital in the trading book, outlaw ‘soft’ capital, increase capital backing for securitizations and strengthen balance sheets generally. BUT will the reforms damage the system and make credit scarce and too costly? A capital shortage:
Bank Balance Sheets expanded Large-cap banks’ aggregate assets rose to 43x tangible book equity, 2000 – 2007 Source: Silverlake, Capital IQ.
UK banks leverage grew sharply from 2003 onwards Major UK banks’ leverage ratio, %, 1998 - 2008 Note: Leverage ratio defined as total assets divided by total equity excluding minority interest. Excludes Nationwide due to lack of interim data. Source: Bank of England, Financial Stability Report, Issue 24, 28 October 2008.
Investment Bank leverage grew Leverage ratios, 2003 - 2007
The charge: The response: Off-balance sheet vehicles: The Canary in the Coalmine Credit creation expanded off banks balance sheets, as banks took advantage of regulatory arbitrage opportunities to skimp on capital. Regulatory capital rules parted from the economic reality, as banks had to support these vehicles when they went under. An economic approach, requiring on-balance sheet treatment of SPVs in future. BUT will this prevent any revival of the securitisation markets and thereby constrain credit unduly?
The growth of securitised credit Securitisation issuance trends in the UK, £ Billion, 2000 - 2007 Source: The Turner Review. A regulatory response to the global banking crisis. March 2009.
The charge: The response: Procyclicality The capital rules tended to accentuate the cycle, allowing banks to hold less capital as asset prices rose, as back-testing revealed low losses and loss given default over previous years. Macro-prudential requirements – which will allow regulators to tighten capital in anticipation of price bubbles bursting – ‘leaning into the wind’. Stress-testing. BUT how do we know when there is a bubble? Why not use interest rates ?
a1. BASEL II: Tier 1 Capital Ratio = 4% Core Tier 1 Capital Ratio = 2% The difference between the total capital requirement of 8% and the Tier 1 requirement can be met with Tier 2 capital a2. BASEL III: Tier 1 Capital Ratio = 6% Core Tier 1 Capital Ratio (Common Equity after deductions) = 4.5% Core Tier 1 Capital Ratio (Common Equity after deductions) before 2013 = 2%, 1st January 2013 = 3.5%, 2014 = 4%, 2015 = 4.5% The difference between the total requirement of 8% and the Tier 1 requirement can be met with Tier 2 capital a. Tier 1 Capital
b1. BASEL II: No Capital Conservation Buffer b2. BASEL III: Banks required to hold a Capital Conservation Buffer of 2.5% to withstand future stress bringing the total common equity requirements to 7% Capital Conservation Buffer will be met with common equity Capital Conservation Buffer before 2016 = 0%, 1st January 2016 = 0.625%, 2017 = 1.25%, 2018 = 1.875%, 2019 = 2.5% The purpose is to ensure that banks maintain a buffer of capital to absorb losses during periods of stress. When regulatory capital ratios approach the minimum requirement, constraints imposed on earnings distributions b. Capital Conservation Buffer
c1. BASEL II: - No Countercyclical Capital Buffer c2. BASEL III: A Countercyclical Buffer within a range of 0% – 2.5% of common equity or other fully loss absorbing capital will be implemented according to national circumstances Banks with a Capital Ratio lower than 2.5% will face restrictions on payouts of dividends, share buybacks and bonuses Phased in from January 2016 to January 2019 Countercyclical Capital Buffer before 2016 = 0%, 1st January 2016 = 0.625%, 2017 = 1.25%, 2018 = 1.875%, 2019 = 2.5% c. Countercyclical Capital Buffer
d1. BASEL II: No explicit Capital for Systemically Important Banks d2. BASEL III: Systemically Important Banks should have loss absorbing capacity beyond the standards. Work continues in the Financial Stability Board and the Basel Committee The Committee and the FSB are developing an integrated approach to systemically important financial institutions which could include combinations of capital surcharges, contingent capital and bail-in debt d. Capital for Systematically Important Banks only
“There is growing recognition that the dispersion of credit risk by banks to a broader and more diverse group of investors, rather than warehousing such risk on their balance sheets, has helped make the banking and overall financial system more resilient. The improved resilience may be seen in fewer bank failures and more consistent credit provision. Consequently the commercial banks may be less vulnerable today to credit or economic shocks.” IMF Global Financial Stability Report April 2006
The capital value of global derivatives peaked at $760 trillion in June 2008 (equals last 20 years of global GDP!). Derivatives, supposedly designed to spread and diversify risk, created new risks and caused financial instability. The complexity of products was impossible for regulators, customers and even originators to understand. Opacity created additional risks: when the crisis hit, no one knew who held the losses. Derivatives: The Problem
Derivative volumes quadrupled in five years OTC derivative volume by product type, volume ($ Trillion), Jun 2003 – Jun 2008 Source: The Turner Review. A regulatory response to the global banking crisis. March 2009.
More capital in the trading book against derivative exposures (see Basel 3). Central Counterparty (CCP). New margin requirements, standardised contracts. (US) Dodd-Frank requires banks to move (some) derivatives out of banks. Derivatives: Solutions
Moral hazard: If the bank is profitable, the managers earn huge amounts, if it fails, the taxpayers pay: Heads they win, tails we lose. Pay incentives drive risk-taking behaviour which can reward individuals in the short-term, but cause the bank losses in the long term. Bankers are simply paid too much. Bankers’ Pay: Problems
Different regimes have been introduced by country: EU: 60% of bonuses deferred for 3 – 5 years. Retention period for share-based incentives. Upfront cash capped at 20%. UK: Additional proposals for disclosure of high earners’ pay. Bonus tax. US: No detailed rules. 75% in shares for senior executives. Bankers’ Pay: Solutions
Lack of competition? Winner takes all? Insider dealing? Opacity? Why are bankers paid so much?
Bank boards did not understand the risks they were taking on. Bank directors were often too old and too ignorant. Risk management was undervalued. Financial Institutions Management and Governance: Problems
(UK) Bank directors interviewed by the FSA and assessed for competence. (UK and US) Board-level risk committees now established. Chief Risk Officers report to CEOs. Regulators attention focussed on risk management. Financial Institutions Management and Governance: Solutions
The ‘plumbing’ of the financial system and its regulation has been overhauled, but problems remain: Highly complex regulatory structure with no central authority. Many conflicts of interest. Regulators still struggle to catch up with markets. Global imbalances, which were at the heart of the crisis, persist. Is it enough?
Regulation since the Crisis: What has changed and is it enough? Howard Davies Director, LSE ICEF Seminar HSE Cultural Centre 29 November 2010