Download
1 / 1
10 likes | 176 Views
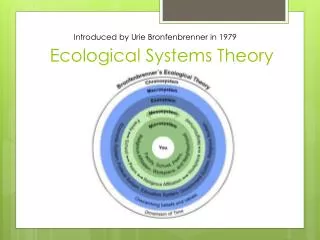
Exploring the Limits of Self-Sustainable Closed Ecological Systems Reported by Meena Padha and Luke Pinnow Faculty Mentor: Dr. Frieda B. Taub University of Washington. 1. 1. Introduction to Closed Ecological Systems

E N D
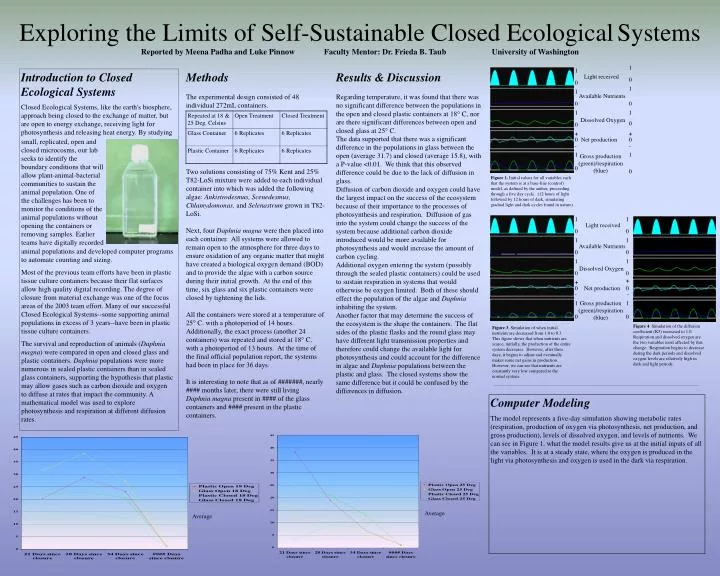
Exploring the Limits of Self-Sustainable Closed EcologicalSystems Reported by Meena Padha and Luke Pinnow Faculty Mentor: Dr. Frieda B. Taub University of Washington 1 1 Introduction to Closed Ecological Systems Closed Ecological Systems, like the earth's biosphere, approach being closed to the exchange of matter, but are open to energy exchange, receiving light for photosynthesis and releasing heat energy. By studying Methods The experimental design consisted of 48 individual 272mL containers. Results & Discussion Regarding temperature, it was found that there was no significant difference between the populations in the open and closed plastic containers at 18 C, nor are there significant differences between open and closed glass at 25 C. The data supported that there was a significant difference in the populations in glass between the open (average 31.7) and closed (average 15.8), with a P-value <0.01. We think that this observed difference could be due to the lack of diffusion in glass. Diffusion of carbon dioxide and oxygen could have the largest impact on the success of the ecosystem because of their importance to the processes of photosynthesis and respiration. Diffusion of gas into the system could change the success of the system because additional carbon dioxide introduced would be more available for photosynthesis and would increase the amount of carbon cycling. Additional oxygen entering the system (possibly through the sealed plastic containers) could be used to sustain respiration in systems that would otherwise be oxygen limited. Both of these should effect the population of the algae and Daphnia inhabiting the system. Another factor that may determine the success of the ecosystem is the shape the containers. The flat sides of the plastic flasks and the round glass may have different light transmission properties and therefore could change the available light for photosynthesis and could account for the difference in algae and Daphnia populations between the plastic and glass. The closed systems show the same difference but it could be confused by the differences in diffusion. Light received 0 0 1 1 Available Nutrients 0 0 1 1 Dissolved Oxygen 0 0 + + 0 Net production 0 small, replicated, open and closed microcosms, our lab seeks to identify the boundary conditions that will allow plant-animal-bacterial communities to sustain the animal population. One of the challenges has been to monitor the conditions of the animal populations without opening the containers or removing samples. Earlier teams have digitally recorded - - 1 1 Gross production (green)/respiration (blue) 0 Two solutions consisting of 75% Kent and 25% T82-LoSi mixture were added to each individual container into which was added the following algae: Ankistrodesmus, Scenedesmus, Chlamydomonas, and Selenastrum grown in T82-LoSi. Next, four Daphnia magna were then placed into each container. All systems were allowed to remain open to the atmosphere for three days to ensure oxidation of any organic matter that might have created a biological oxygen demand (BOD) and to provide the algae with a carbon source during their initial growth. At the end of this time, six glass and six plastic containers were closed by tightening the lids. All the containers were stored at a temperature of 25 C. with a photoperiod of 14 hours. Additionally, the exact process (another 24 containers) was repeated and stored at 18 C. with a photoperiod of 13 hours. At the time of the final official population report, the systems had been in place for 36 days. It is interesting to note that as of #######, nearly #### months later, there were still living Daphnia magna present in #### of the glass containers and #### present in the plastic containers. 0 Figure 1. Initial values for all variables such that the system is at a base-line (control) model, as defined by the author, proceeding through a five day cycle. (12 hours of light followed by 12 hours of dark, simulating gradual light and dark cycles found in nature). 1 1 Light received 0 0 1 1 Available Nutrients animal populations and developed computer programs to automate counting and sizing. Most of the previous team efforts have been in plastic tissue culture containers because their flat surfaces allow high quality digital recording. The degree of closure from material exchange was one of the focus areas of the 2003 team effort. Many of our successful Closed Ecological Systems--some supporting animal populations in excess of 3 years--have been in plastic tissue culture containers. The survival and reproduction of animals (Daphnia magna) were compared in open and closed glass and plastic containers. Daphnia populations were more numerous in sealed plastic containers than in sealed glass containers, supporting the hypothesis that plastic may allow gases such as carbon dioxide and oxygen to diffuse at rates that impact the community. A mathematical model was used to explore photosynthesis and respiration at different diffusion rates. 0 0 1 1 Dissolved Oxygen 0 0 + + 0 Net production 0 - - 1 Gross production (green)/respiration (blue) 1 0 0 Figure 4. Simulation of the diffusion coefficient (K5) increased to 1.0. Respiration and dissolved oxygen are the two variables most affected by this change. Respiration begins to decrease during the dark periods and dissolved oxygen levels are relatively high in dark and light periods. Figure 3. Simulation of when initial nutrients are decreased from 1.0 to 0.3. This figure shows that when nutrients are scarce, initially, the production of the entire system decreases. However, after three days, it begins to adjust and eventually makes some net gains in production. However, we can see that nutrients are constantly very low compared to the normal system. Computer Modeling The model represents a five-day simulation showing metabolic rates (respiration, production of oxygen via photosynthesis, net production, and gross production), levels of dissolved oxygen, and levels of nutrients. We can see in Figure 1. what the model results give us at the initial inputs of all the variables. It is at a steady state, where the oxygen is produced in the light via photosynthesis and oxygen is used in the dark via respiration. Average Average