Download
1 / 21
210 likes | 309 Views
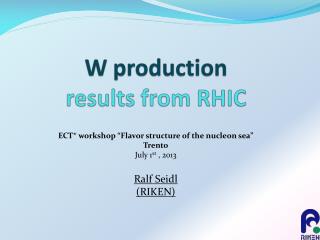
Enhancement of primary production at greater resolved scales Results from the Greenseas project. 45th International Liège Colloquium 13 – 17 May 2013 Liège, Belgium . W McKiver, M Vichi , T Lovato, A Storto, S Masina. The greenseas project. 9 partners, led by NERSC, Bergen

E N D
Enhancement of primary production at greater resolved scales Results from the Greenseas project 45th International Liège Colloquium 13 – 17 May 2013 Liège, Belgium W McKiver, M Vichi, T Lovato, A Storto, S Masina
The greenseas project 9 partners, led by NERSC, Bergen GreenSeasemploys a combinationofobservation data, numericalsimulations and a cross-disciplinarysynthesistodevelop a high quality, harmonized and standardized plankton and plankton ecology long time-series, data inventory and information service
Questions and aims • Global plankton data are sparse and the usageofbiogeochemical data formodelassessmentraisesseveralquestions: • Do in situ data have enough signal to allow extrapolation? • What are the limits of model assessment given the available data? • Are rates and process measurements more evanescent than stock data? • Can we efficiently use mesoscale features from satellite products? • On the modelling side, advances in computationaltechnologyhas led to more complicatedmodels at greaterspatial and temporalresolution. More details can beproducedbut the production costs are high. • Herewe focus on a directcomparisonbetween a OBGCM used at twodifferentresolutions: • LO-RES –2degreeresolution • HI-RES –¼degreeresolution
The Model: PELAGOS • PELAgicBiogeochemistryfor Global OceanSimulation (Vichi et al., 2007a,b; Vichi and Masina 2009) • Global oceanimplementationof a couplingbetweem: • BiogeochemicalFluxModel (BFM): Biomassbased continuum descriptionoflower trophic levelsthrough a set ofdifferentialequationsthatsolves the dynamicalstoichiometryoffluxesofC, N, P, Si and Fe amongselectedbiologicalfunctionalgroups • NEMO OceanModel (v3.4): Primitive equationsformomentum, temperature, salinitywith LIM2 Seaicemodel, (Madec et al., 1998) • Modelisimplemented on ORCA grid at both2degree and ¼degreeresolutionwith the samebiogeochemicalparameterizations
Biogeochemical Flux Model (BFM) http://bfm-community.eu • Stoichiometric biomass-basedmodel, with a unifiedtheorybuilt on the conceptofChemicalFunctionalFamilies • Allowstodescribelower trophic levelsbyimplementinganynumberoffunctionalgroups and constituents • Standard pelagicsetting: • C,N,P,Si,Fe,O,Alk • 3phytoplanktongroups • 3zooplanktongroups • 1bacterioplankton • Open source code online: • http://bfm-community.eu
Biogeochemical Flux Model (BFM) http://bfm-community.eu Some theory: Vichi et al. 2007 (JMS)
ORCA2 vs ORCA025 • HorizontalGrid182 x 149 1442 x 1021 • Vertical Levels31 50 • TimeStep96 mins 18 mins • BFM: 57 Pelagic state variableswith full diagnostics • Largecomputingpower ~ 900 cores. Largememoryrequirementsfor HI-RES, 850 GB • Largestoragerequirement, approx 18 GB output pertimeunit
Experimental setup • Simulationsperformed at ORCA2 (LO-RES) and ORCA025 (HI-RES)resolutionwithsameatmospheric forcings from ERA-interim (on-line interpolation) • LO-RES modelrunfor 30 years • HI-RES physicsrunfor4years, thencoupledto the biogeochemicalmodelusing the biogeochemicalvariablesinterpolatedfrom the LO-RES experimenttoinitialize. January and Juneinitializations. • Thenboth LO- and HI-RES models are runfor6monthsstoringevery8days • Ourresultswillmainly focus on the Atlantic and SouthernOceanwhichis are well-knownregionswithlargemodelbiases • Presentfirst the physicaldrivers and thenexaminetheir impact on the marine biogeochemicalsystem (and relatedproblems!)
Physical Drivers: Mean EKE/Wind Stress • Momentumis put into the system through the wind-stress. • Boththe LO-RES and HI-REScasesconverts a certainamountofthisintokineticenergy. • Herewe show the ratioof the total averageTurbulentKinetic Energy and the Wind Stress forboth the LO-RES (blue) and HI-RES (red) experiments. • The HI-RESexperimenthasmuchhigher TKE.
Ratio of Vertical to Horizontal motion LO-RES HI-RES • As a qualitative indicatorof the relative importanceof the verticalmotionswe show the averagedvertical-to-horizontalvelocityratios. • Overallverticalmotions are muchstronger in HI-RES case as the mesoscaleisresolved
Mixed Layer Depth: Seasonal cycle Tropical Atlantic North Atlantic Southern Ocean • LO-RES ---de BoyerMontegut et al. 2004 --- • HI-RES ---Hosoda et al (Argo) 2010 --- • MLD ismuchdeeper in the HI-RES • Particularlystrong difference in the SouthernOcean • Overallthe physicsisverydifferent in the twocases, howdoesthis impact the biology?
Evolutionafter3months (March) LO-RES (initialfor HR) HI-RES Seawifs LO-RES
Net PhytoplanktonGrowth Rate [mg C/m3/d] (March) Overall enhancement of coastal production
SurfaceChl [mg/m3] (March) Overall enhancement of coastal chl
Net production [mg C/m3/d] and Chlorophyll [mg/m3] Note the change of units! This decoupling is a consequence of variable chl:C!
Example timeseries (summertowinter) on the APF • LO-RES –2degHI-RES –¼deg
Ironcycle [umol/m3] isnotbalanced at Hi-Resscales Scale is 5 times larger!
Summary • Performedsimulations at twodifferentresolutions • Clearlyhigherresolutionenhancesthe mesoscalefeatureshavingan impact on the marine plankton • Enhancedgrowth in coastalregions, whilegrowthis first enhanced and thensuppressed in the SouthernOcean • Notallparameterizations are resolutiondependentasbiogeochemicalfeaturesget (visually) better (more physics, more details). However, “loophole” parameterizationsas in the Fe case are more dangerousas remineralization parameters are scale dependent • Thisis just the modelling side. Assessmentphasehasstarted. • Chainofrestarts: whathappens in the HI-RES beyond the adjustmentphase? Isthereconvergence? • Howmuchresolvedscales are needed? Can some intermediate resolutionaddress the costissuewhileprovidingbetterphysics? Future work