Download
1 / 8
80 likes | 207 Views
Monitoring Riparian Buffer Zones along the Tar River Basin using EOS Land Products. Jennith Thomas, Terence Goard, Shakeila Jones, and Ryan Wegener Louisburg College, NC (USA) Derek Halberg Tar River Land Conservancy, NC (USA) Lucy McFadden and Miguel O. Román

E N D
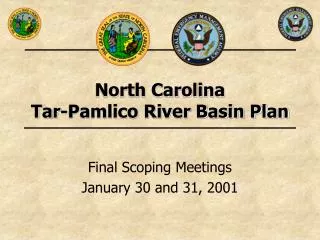
Monitoring Riparian Buffer Zones along the Tar River Basin using EOS Land Products Jennith Thomas, Terence Goard, Shakeila Jones, and Ryan Wegener Louisburg College, NC (USA) Derek Halberg Tar River Land Conservancy, NC (USA) Lucy McFadden and Miguel O. Román NASA Goddard Space Flight Center, MD (USA) • SUPPORT: • NASA-GSFC Office of Higher Education (600) • GSFC Terrestrial Information Systems Branch (614.5) • NASA-CIPAIR program (Grant #NNX10AU70G) • Tar River Land Conservancy
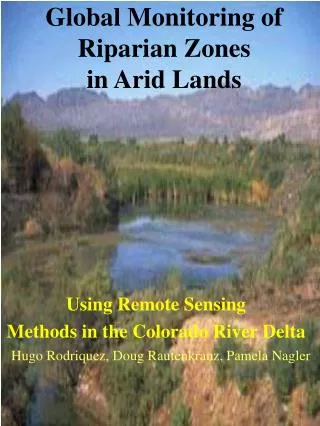
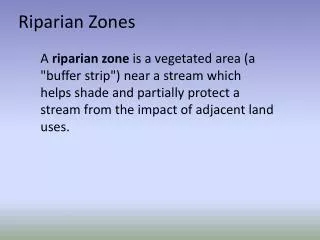
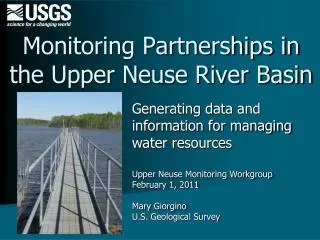
Overview - Riparian buffer zones are vital to the ecological and biological health of watershed ecosystems. - This project focused on a region (26,000 km2) of North Carolina, USA, including the Tar River. Remote Sensing and GIS Tools MODIS Land Biophysical Products LEDAPS 30m Surface Reflectance NC Division of Water Quality GIS Data
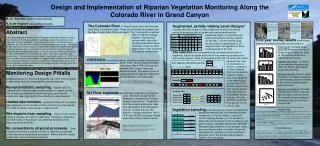
Upper Tar River Basin • LST is sensitive to vegetation and soil moisture; hence it can be used to detect land use/land cover changes. • LAI is used to calculate evapotranspiration and eventually affects water characteristics (e.g., stream volume, flow, and quality). • GPP: measures organic compounds produced by plants from ambient carbon dioxide.
10yr MODIS Time Series over Tar River Basin LST LAI GPP
Change-Detection Analysis using LEDAPS NDVI 08/1999 08/2008 R/O = Disturbed Y = Stable or No Change G = Regenerated
RELEVANCE TO NASA: - NASA’s Strategic Mission Goal #2:“To expand scientific understanding of the Earth and the universe in which we live.” - NASA’s Strategic Mission Goal #6:“To share NASA with the public, educators, and students to provide opportunities to participate in our mission, foster innovation and contribute to a strong National economy.” SCIENTIFIC SIGNIFICANCE: Citizens of North Carolina will receive new information and analysis insights into the ecological functioning and biodiversity of the Upper Tar River watershed.
SUMMARY • We have established a framework of information for the upper Tar River Basin using EOS Land Products and GIS data. • We have determined the best way to capture the spatial (30m) and temporal scales (~2-5 years) of disturbed riparian communities. • We plan to do field work, particularly validation, in support of land biophysical products retrieved from VIIRS and Landsat/LDCM. • Using ENVI and ArcGIS Spatial Analyst, we will generate buffer zones around protected areas to develop a capability that provides automated disturbance detection and monitoring of riparian forest buffers may be accomplished from satellite observations.