Download
1 / 15
150 likes | 300 Views
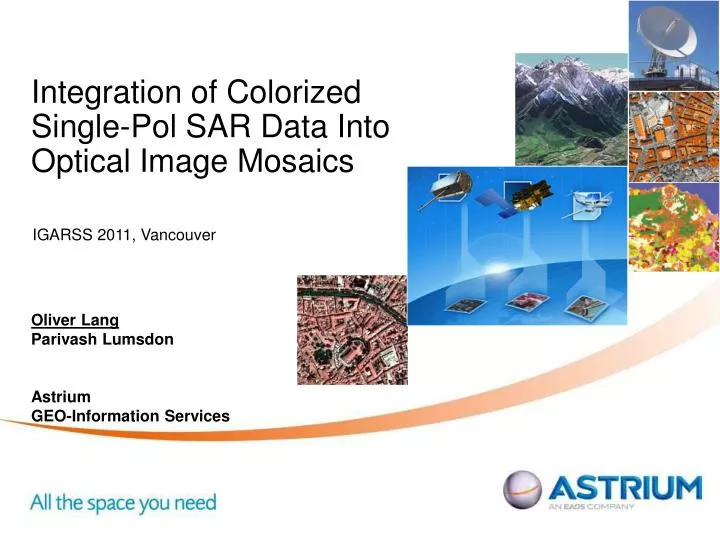
Integration of Colorized Single-Pol SAR Data Into Optical Image Mosaics. IGARSS 2011, Vancouver. Oliver Lang Parivash Lumsdon Astrium GEO-Information Services. Motivation. Thematic mapping in Cloud Belt using single-pol SAR

E N D
Integration of Colorized Single-Pol SAR Data Into Optical Image Mosaics IGARSS 2011, Vancouver Oliver LangParivash Lumsdon Astrium GEO-Information Services
Motivation • Thematic mapping in Cloud Belt using single-pol SAR • Cost effective approach: single coverage, full resolution + swath width • Mosaic electro-optical image mosaics with seamless SAR mosaics, colorized in meaningful way • Commercial TerraSAR-X data distribution by Astrium: Colored quick looks come with TSX data since 2010BUT: varying colors, not intuitive Development of new add-on product: Color Composite IGARSS Vancouver – 27 July 2011
mean STD Single-Pol SAR Colorization • Known: Basic „classification“ based on Speckle variations • Coeff. of Variation as measure for local speckle noise • Link to main surface types: • Large CoV: heterogenious (urban) • Small CoV: homogenious (water, grassland) • New: • combination of multiple texture filters • Colorization according to reference image S. Kuntz and F. Siegert, “Monitoring of deforestation and land use in Indonesia with multitemporal ERS data.” International Journal of Remote Sensing 20: 2835-2853, 1999 M. Thiel., T. Esch, and S. Dech, “Object-oriented detection of settlement areas from TerraSAR-X data” Proceedings of the EARSeL Joint Workshop: Remote Sensing: New Challenges of high resolution. (Eds.,Carsten Jürgens), 2008 IGARSS Vancouver – 27 July 2011
General Approach • Apply multiscale texture filters • Classification based on filter layers • Colorization of „classes“ with given LUTs IGARSS Vancouver – 27 July 2011
Generation of filter layers • Derivation of multi-scale texture components • Mean • Standard Deviation • Variance • Skewness Coeff of Variation • Spectral high-pass • Noise components: • Multiplicative Noise S: apply Gaussian filter • Additive Noise N = apply directional Lee filtered IGARSS Vancouver – 27 July 2011
Urban Forest Water 0 50 100 150 200 250 STD mean Classification Histogram • Hierarchical unsupervised classification based on filter layers • Min-distance based on empirical thresholds • Backscatter & speckle characteristics allows reliable separaton of (calm)Water / Urban • Third class is separated into hetero- and honogenious sub-class (e.g. Forest / Grassland) • Decider: local Variance value IGARSS Vancouver – 27 July 2011
Example: selection of sample areas Background image: Google Earth STD Saturation hue mean Selection of Colors • 2 methods: • Predefined standard color tables • (optical) reference image • Manual or automatic selection of samples for each class • Derivation of Hue values from samples and quantization of colors to a desired number of colors 4 LUTs • HSV RGB Transformation IGARSS Vancouver – 27 July 2011
2 Examples • Overlay: Spot 4 and TerraSAR-X Stripmap • Overlay: TerraSAR-X Spotlight in Google Earth IGARSS Vancouver – 27 July 2011
10 km Example: Cameroon SPOT4: date: 8 Jan 201120 m resolution, Layers 4, 1, 2 TerraSAR-X: Date: 29 Jul 2010 StripMap, 3 m res HH polarization IGARSS Vancouver – 27 July 2011
10 km Water Agriculture Forest Urban Example: Cameroon • Color tables derived from overlapping optical scene • Nr. of quantized colors: 16 SPOT4: date: 8 Jan 20120 m resolution, Layers 4, 1, 2 TerraSAR-X: Date: 29 Jul 2010 StripMap, 3 m res HH polarization IGARSS Vancouver – 27 July 2011
urban forest agriculture water Example: Germany • Quantization: 256 colors / class Germany: TerraSAR-X HS IGARSS Vancouver – 27 July 2011
urban forest agriculture water Example: Germany Germany: TerraSAR-X HS Background image: Google Earth IGARSS Vancouver – 27 July 2011
Clouds 0% 100% Discussion • Sensor and SAR-mode independent qualitative approach • Supports thematic mapping as additional information layer, e.g. in cloud belt • Intuitive visualization and interactive interpretation • SAR specific backscatter characteristics remain • Inherently, differences regarding surface representation between optical and SAR remain • Further improvements expected by optimized classification procedure & automatic LUT derivation IGARSS Vancouver – 27 July 2011
Thank You Astana, KasachstanTerraSAR-X StripMap ColorSAR IGARSS Vancouver – 27 July 2011
Contact Dr. Oliver Lang Senior Application Development Manager Development & Engineering | Infoterra GmbH GEO-Information Services Astrium GmbH - Services Claude-Dornier-Str. | 88090 Immenstaad | Germany Tel +49 7545 8 5520 | Fax +49 7545 8 1337 | Mob +49 151 1822 0827 Oliver.Lang@astrium.eads.net | www.infoterra.de IGARSS Vancouver – 27 July 2011