Download
1 / 31
310 likes | 479 Views
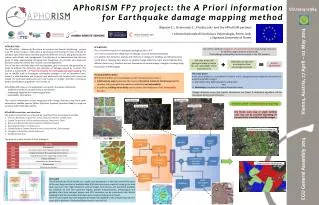
SAR and Optical satellite data for earthquake damage mapping. S. Stramondo 1 , C. Bignami 1 , M. Chini 1 , N. Pierdicca 2 1 Istituto Nazionale di Geofisica e Vulcanologia, Via di Vigna Murata 605, 00143, Rome, Italy (chini@ingv.it).

E N D
SAR and Optical satellite data for earthquake damage mapping S. Stramondo1, C. Bignami1, M. Chini1, N. Pierdicca2 1Istituto Nazionale di Geofisica e Vulcanologia, Via di Vigna Murata 605, 00143, Rome, Italy (chini@ingv.it). 2Dept. of Electronic Engineering, Sapienza University of Rome, Via Eudossiana 18, Rome, Italy.
Overview • Introduction and objectives • New space missions for EO and natural disaster mitigation • SAR and optical feature extraction • SAR and Optical data processing chain • Damage assessment products • Test cases: • Izmit earthquake (1999): City block damage level • Bam earthquake (2003): Single Building Damage Level • China earthquake (2008): VHR X- and L-band SAR • Conclusions
Introduction and Objectives • Satellite Remote Sensing has assumed an important role in supporting natural disaster management and mitigation. • It provides a synoptic view of surface effects due extreme events. Concerning earthquakes EO data are used to generate a detailed map of damage to urban structures. • Therefore the potential of SAR and Optical images can be exploited to support the decision chain of Civil Protection for crisis management and to provide a rapid mapping of damage to buildings and infrastructures. • Combining SAR and Optical images overcome some limitation as those due to weather conditions and Sun illumination. • Analyzing the capability of remote sensing techniques for damage detection and classification in urban areas • Exploiting an approach integrating pre- and post- seismic data of both optical and radar (SAR) data
New space missions for EO and natural disaster mitigation • The new generation of L, C and X-band SAR sensors, with polarimetric capabilities, is now available. • The Japanese ALOS PALSAR, or TerraSAR-X from DLR and Cosmo-SkyMed from ASI, or the new C-band Radarsat-2 are dramatically enforcing the role of SAR systems in disaster monitoring. • These sensors provide high performance in terms of spatial resolution and revisiting time (some of them are satellite constellations) thus matching most of the end user requirements. • Forthcoming studies will concern the full exploitation of VHR data, either Optical and SAR.
SAR and Optical features extraction Optical Provides a prompt overview of damages and is correlated to damage level, derived by: - Histogram matching between the pre- and post-seismic acquisitions - Normalized Change Image (NCI) definition SAR - Both complex coherence and intensity correlation decrease when derived from co-seismic image pairs with respect to pre- or post- seismic pairs. - This is due to phase changes of the scattered field components at subpixel scale i.e., changes in scatterers geometrical arrangement.
Example of SAR features Pre-seismic intensity correlation Co-seismic intensity correlation Co-seismic coherence Pre-seismic coherence • Decrease of intensity correlation is quite apparent in Bam example • InSAR coherence of urban areas low in pre-seismic pair because of high spatial baseline (450 meters) so that change is not significant
Damage assessment products From our experience:
Izmit earthquake (1999): SAR and Optical data sensitivity to city block damage level Ground truth with five different damage levels.
Izmit earthquake (1999): City block damage level from ground survey Available ground truth, i.e. the collapse ratio in Adapazari city ranges from 0% to 41% and is a 7-level one. Available ground truth, i.e. the collapse ratio in Golcuk city ranges from 0% to 100% and is a 5-level one.
Izmit earthquake (1999): City block damage level from SAR and Optical data Adapazari satellite damage levels map
Izmit earthquake (1999): City block damage level comparison The ground truth ROIs extracted from KOERI damage map have been superimposed to the satellite dataset and the damage level estimation has been performed and compared with the ground truth
Izmit earthquake (1999): SAR and Optical data Integrated Damage Index Now, the damage map is the result of the fusion of SAR Correlation and IRS Change Index. The Integrated Damage Index is then defined leading to the estimation of damage within certain regions (unaffected by clouds to maximize the role of both data). A non-linear fitting function is then used to define an empirical data fusion approach.
VHR image classification VHR remote sensing data are potentially able to provide very detailed mapping of the urban environment with a sub-meter ground resolution. At the same time, the increase in volume of data creates additional problems in terms of automatic classification The urban area appears as a complex structure containing buildings, transportation systems, utilities, commercial buildings and recreational areas. At different scale, a simple building may appear as a complex structure also, with many architectural details surrounded by gardens, trees, buildings, roads, shadows, social and technical infrastructure and many temporary objects, such as cars, buses, etc…
Bam earthquake (2003): Single Building Damage Level Even though the very high resolution, panchromatic images are not used for automatic urban classification studies and multiscale contextual analysis are essential being applied. A multiscale morphological analysis is carried out in order to extract geometrical information from adjacent pixels in a panchromatic image; this allows to improve the building classification overcoming the spectral information deficit of panchromatic imagery. The previous outcomes are the basis to labeling each building and defining a Single Building Damage Level (SBDL) criteria. Test case: Bam city (IRAN), affected by December 26th, 2003, earthquake The main goal is to label each building based on an SBDL criteria.
Bam earthquake (2003): Single Building Damage Level Shadow effects January 4, 2004 Off-nadir angle: 23.8° September 30, 2003 Off-nadir angle: 9.7°
Bam earthquake (2003): Single Building Damage Level QB Pan1 09/30/2003 QB Pan2 01/04/2004 QB Change Pan1-Pan2
Bam earthquake (2003): Single Building Damage Level Morphological operators Panchromatic image Panchromatic image filtered by Open Operator with 3x3 window Panchromatic image filtered by Open Operator with 5x5 window
Bam earthquake (2003): Single Building Damage Level Morphological profile of six different classes The window size spans from 3x3 up to 125x125 pixels The feature vector is composed of 37 elements
Bam earthquake (2003): Single Building Damage Level • Input: Panchromatic image + Panchromatic Images filtered by Open and Close Operators with different window size (Morphological profile) • The buildings have been classified using an unsupervised classifier Buildings Map of Bam City on September 30, 2003 September 30, 2003
Bam earthquake (2003): Single Building Damage Level Building Map 09/30/2003 Building Map 01/04/2004 Single Building Identification (Labeling) Single Building Damage Level Map Single Building Damage Level (SBDL): ratio between number of pixels which compose a building before and after the earthquake SBDL spans from 0 to 1 values
Bam earthquake (2003): Single Building Damage Level Three different levels of damage: Light (or No Damage), Medium and Heavy.
Bam earthquake (2003): Single Building Damage Level • Comparison between SBDL statistic and Ground Survey: • Total Buildings: • SBDL=12498 • Ground survey=12063 • Error=3,6% • Heavy damaged: • SBDL=6615 • Ground survey=6150 • Error=7%
Bam earthquake (2003): Single Building Damage Level Pan 09/30/2003 Pan 01/04/2004
China earthquake (2008): • The magnitude Mw=7.8, May 12, 2008 earthquake which struck the Sichuan region in China, has been imaged by the new COSMO-SkyMed radar satellites. • On May 12, immediately after the mainshock, the Italian Department of Civil Protection requested ASI to program new image acquisitions over the Sichuan region, using stripmap (swath 40 km wide, ground resolution 3 m) and spotlight (swath 10 km, resolution 1 m) modes. • Two images, acquired one month before and two days after the quake, have been used to generate the first ever X-band coseismic interferogram, which clearly shows part of the strong ground deformation caused by the fault dislocation. • A different analysis of the same data also allowed to detect several changes in radar response presumably due to strong seismic damage as far as 80 km from the epicenter.
China earthquake (2008): COSMO-SkyMed Two COSMO-SkyMedstripmap images of Chengdu city. In the following some examples extracted from the 40 x 40 km area covered by the COSMO images. The pixel size is at 6 x 6 m. Buildings and infrastructures are viewed from WSW under an incidence angle of 45°. The differences (in red) between the pre- and post-event images are striking and affect mainly bridges along motorways and large buildings.
China earthquake (2008): COSMO-SkyMed Actually no ground truth maps have been used for satellite data validation. As soon as VHR optical images are available we will apply data fusion procedures to fully exploit the combination of SAR and optical features. As soon as further data available already tested damage classification schemes (SAR+VHR+Morphologicaloperators+Neural Networks) will be applied.
China earthquake (2008): ALOS - PALSAR ALOS PALSAR Fine Beam Single Pol. Pre = orbita 10835 5/2/2008 Post= orbita 12845 22/6/2008
Conclusions: City block damage level • The 1999 Turkey test case has been fully analyzed. Outcomes from Golcuk city have been used to obtain a general correlation between collaspe ratio and SAR and/or Optical data • A damage map at building block scale has been then obtained • An empirical model stemming from SAR+Optical fusion has been defined. It is a non linear fitting function • An upgraded damage map, from three to five level, has been showed
Conclusions: Single Building Damage Level • The approach is based on VHR optical images. Even though the very small details are detectable on the contrary the very high complexity of each image results in a large number of false alarms • Stemming from VHR data and thanks to the application of morphological analysis damage at single building scale can be identified and classified • Temporary objects that are not part of the earthquake damage and have been removed • The SBDL index has been defined and applied to the Bam test case. Results are satisfactory.
Conclusions: VHR X- and L-band SAR • The high flexibility of the Cosmo SAR sensor was originally designed mainly for disaster reconnaissance and assessment, and the Sichuan earthquake was one of its first test benches. Even in its presently incomplete, and not yet operational, configuration, Cosmo Skymed has successfully demonstrated to be able to acquire, in very short times high quality images of disaster areas useful for crisis management and scientific research. • We stress that, for the most effective use of Cosmo imagery in disaster applications using the assessment of changes between pre- and post-event conditions, a background data acquisition policy will have to be devised to acquire and archive on a routine basis. • Since June 2008 the first Cosmo Skymed satellite has been fully operational and the system will progressively reach its complete monitoring capacity with all four satellites by 2009.