Download
1 / 37
370 likes | 379 Views
Probability and Statistics for Computer Engineer. What is model? Type of Models Purpose of the Class Course Overview. Model. Model Virtual system to explain phenomena or behavior Example Stock price and weather forecasting rule, Ohm ’ s law Types of Models

E N D
Probability and Statistics for Computer Engineer What is model? Type of Models Purpose of the Class Course Overview
Model • Model • Virtual system to explain phenomena or behavior • Example • Stock price and weather forecasting rule, Ohm’s law • Types of Models • Deterministic v.s. Statistic(Stochastic) • Chaotic v.s. Non-chaotic • Deterministic Model Differential Equations, Functions, Transform
Model • Statistical Model • Not data but statistics(mean, variance, probability density function) • Uncertainty • Ambiguity due to lack of evidence • Relative Frequency • Vagueness inherent in language • Probability • Mathematical model of relative frequency • Relative Frequency
Why we need to study? • Purpose of Study • Tool for analyzing & understanding statistical models • Related Courses in Computer Engineering Statistical Pattern Recognition and Machine Learning Data Mining Data Communication Artificial Intelligence Simulation Engineering Statistical Communication Theory Digital Signal Processing Image Processing
Lecture Plan • Text 공학인증을 위한 확률과 통계이재원외 카오스북 • Topics to be covered • Descriptive Statistics • Probability and Random Variables • Sample Distrribution • Statistical Estimation • Hypothesis Test
Lecture Plan • Grading Policy • Exam I 25%, Exam II 25%, Exam III 25% • Home Work with Programming 15% • Presence 10%
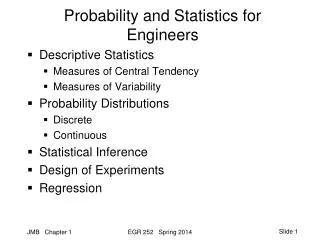
Descriptive Statistics Graph for Data Analysis Sample mean, Variance and Standard Deviation Histogram and Cumulative Histogram Measures of Central Tendency Bivariate Data and Scatter Diagram (Plot) Covariance and Correlation Coefficient Uniform Random Number for Simulation
Graph for Data Analysis • Data Table, Graph • Data: • Summarized for some purpose and • Graph • Histogram of frequency • Dispersion plot • Cumulative histogram of frequency
Graph for Data Analysis • Example: Sample weights of male student • {65,67,64,66,63,….62} • Ascending OS = {53, 58, 60, 61, … 72} • Frequency Distribution
Graph for Data Analysis • How to make frequency table (도수분포표) • Number of classes (계급수): 6-20 • Class interval (계급범위)= [Range(Max. Data–Min Data)/Number of class +1] • Type of Graphs for Univariate • Histogram of frequency • Relative frequency = frequency/total number of data • Frequency polygon • Cumulative relative frequency polygon
How to calculate the sample mean? What does the sample mean stand for? Anything else for more precise description of the data ?
Sample Mean, Variance and Standard Deviation • Example: • Height data of all the students in this class (Not sample, but population) • Weights of sampled male students in CBNU (Sample) • (Sample) Mean of the data • A representatives of the data • Simple but not enough description
Sample Mean, Variance and Standard Deviation • Note : • Optimal in the sense of sum of squared residuals • Sometimes it is poor: Outlier (외톨이) Data Example: 98 96 97 68 97 Mean = 91.2 Is it reasonable? • Kinds of Representatives Median of the data, Trimmed mean of the data Needs of the other representatives than mean
Sample Mean, Variance and Standard Deviation • Sample Variance and Standard Deviation • Unit of standard deviation = Unit of data • A measure of dispersion of data • Variance with mean is still not enough to describe data. • Then how can the data be described completely?
Histogram and Cumulative Histogram • Frequency/Cumulative Frequency
Histogram and Cumulative Histogram Histogram Cumulative Histogram The area of the histogram = 100 The area of the relative frequency = 1.00 Non-decreasing property of cumulative histogram Probability is a mathematical model of relative frequency. The most precise description of data : Density or Distribution
Population and Sample • Population (모집단) • 관심의 대상이 되는 모든 가능한 관측치나 측정값의 집단 • 유한모집단(선거인), 무한모집단(자연수 공간) • Sample (표본) • 일정기준에 의해 추출한 모집합의 부분집합 • 예: 스마트 폰 공장의 불량검사 • Population: 생산된 모든 스마트폰 • Sample: 임의로 추출된 일정 대수의 스마트 폰
Population and Sample • Parameter(파라메터) • 모집단으로부터 얻어진 자료의 특성치 또는 요약치 • 예: 모평균( ), 모분산( ), 모표준편차( ) • Statistics(통계치 또는 통계량) • 표본의 특성이나 성격을 나타내는 수치 • 예: 표본평균( ), 표본분산( ), 표본표준편차(s), 최빈수(mode)
Population and Sample • Summary
Measures of Central Tendency • Arithmetic mean(산술평균) • Geometric mean (기하평균) • Harmonic mean (조화평균) • Median (중위수) • Mode (최빈수) • Weighted average (가중평균) • Winsored mean
Arithmetic Mean (산술평균) • Mean in frequency distribution • Freq. in population • Sample freq. • Class center of population • Class center of population • Number of classes Remember these equation for understanding the expected value.
Arithmetic Mean • Example: Number of responsible family members of a worker
Arithmetic Mean • Features of arithmetic mean • The simplest representative • Good estimate of central tendency • Optimal with respect to mean squared error • Center of the range in symmetric distribution • Sensitive to outlier
Median (중위수) • Median, Center value after sorting the magnitude Example Med {3, 4, 10, 9} = (4+9)/2 = 6.5 P = {50,75,60,55,70,200,55,55} Arithmetic mean= 77.5 Median = (55+60)/2 = 57.5 Which one is better for central tendency? Outlier = 200
Mode (최빈수) • Mode, The value that has the maximum freq. Position of concentration in freq. In symmetric distribution In single-mode asymmeric distribution Example: Mode(2,3,2,1,4) = 2, Mode(5,6,7,8) = None Mode(9,5,4,8,9,8) = 8 or 9
Mode • Example
Weighted Mean (가중평균) • Dataand weight • Weighted Mean • Example: 영어(4학점,C(2점)), 통계학(3학점,A(4점)), 체육(1학점,A(4점)) Weighted Mean= (4x2 + 3x4 + 1x4)/(4+3+1) = 3(B)
Winsored Mean • Winsored Mean • Sort the data in order, subtutute the data less than ¼-th order into ¼-th data, and the data greater than ¾-th order into ¾-th data, and take the average • Example: S = {5,6,7,8,9,11,13} Winsored data = {6,6,7,8,9,11,11} Winsored Mean= Sum of Winsored data/n=58/7
Bivatiate Data and Scatter Diagram • Scatter Diagram(Plot) for Multivariate Data • Something to be considered • Density: No. of data in an unit volume • Relation between variables: • Regression Analysis • Correlations between variables
Covariance and Correlation Coefficient • Covariance and correlation Coefficient • Properties • Factor Analysis
Covariance and Correlation Coefficient • Just thinking about • 2-D or more dimensional (accumulated) histogram • Linear Regression
Uniform Random Number • Examples • Histogram of fair die or coin • Note: • Cumulated histogram of the fair die • Law of Large Number • Random number with any distribution can be generated from uniform random number.
Homework #1 • Matlab Installation • Calculation of • Sample Mean, Variance and Standard Deviation • Linear Regression • Covariance and Correlation Coefficients • Program • Generate uniform random number • Making a fair die • Experiment and count the frequency • Draw the histogram and cumulative histogram