Download
1 / 47
470 likes | 569 Views
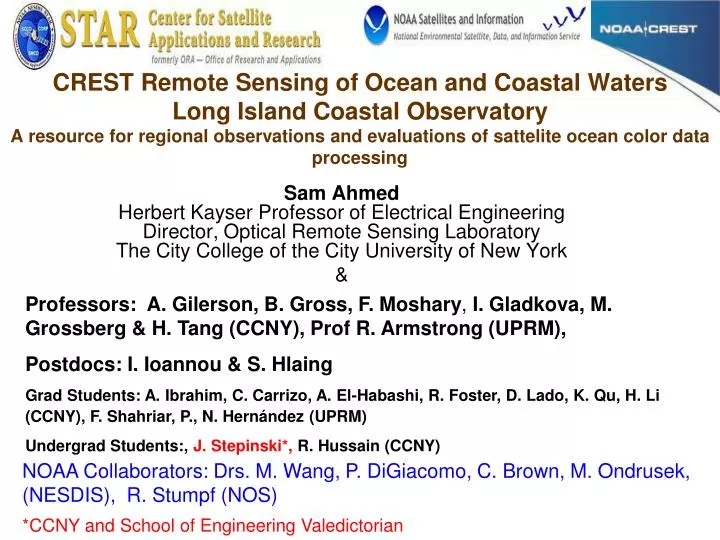
Sam Ahmed Herbert Kayser Professor of Electrical Engineering Director, Optical Remote Sensing Laboratory The City College of the City University of New York &.

E N D
Sam AhmedHerbert Kayser Professor of Electrical EngineeringDirector, Optical Remote Sensing Laboratory The City College of the City University of New York & CREST Remote Sensing of Ocean and Coastal WatersLong Island Coastal ObservatoryA resource for regional observations and evaluations of sattelite ocean color data processing Professors: A. Gilerson, B. Gross, F. Moshary, I. Gladkova, M. Grossberg & H. Tang (CCNY), Prof R. Armstrong (UPRM), Postdocs: I. Ioannou & S. Hlaing Grad Students: A. Ibrahim, C. Carrizo, A. El-Habashi, R. Foster, D. Lado, K. Qu, H. Li (CCNY), F. Shahriar, P., N. Hernández(UPRM) Undergrad Students:, J. Stepinski*, R. Hussain(CCNY) NOAA Collaborators: Drs. M. Wang,P. DiGiacomo,C. Brown, M. Ondrusek, (NESDIS), R. Stumpf (NOS) *CCNY and School of Engineering Valedictorian
CREST highlights • Numerous field campaigns in coastal waters in support of: • Advanced algorithms for retrieval of water parameters • Utilizing polarization properties of ocean and coastal waters for improved IOP retrievals • Development of Long Island Sound Coastal Observatory for the validation of the Ocean Color satellites and development of enhanced coastal IOP retrieval techniques • Hydrodynamic modeling for coastal waters • Hperspectral remote sensing of shallow coastal environments
Comprehensive Instrumentation for Measurement & Simulation Cycles Physical properties Optical properties Reflectance spectra Satellite sensor data • Instrumentation includes: • WET Labs package: absorption, attenuation, scattering, backscattering, Chl concentrations, CDOM fluorescence, temperature, salinity, • LISST for particle size distribution • Hyperspectralprofiler (Satlantic) and GER spectroradiometer for water reflectance measurements above and below water surface • Multi-angular hyperspectralpolarimeter and full Stokes vector imaging camera • Water sampling (Chl, TSS and mineral concentrations, CDOM absorption)
Areas of field campaigns Our partners: NOAA –NESDIS, NOS NRL, SSC, DC NASA – GISS, GSFC, LARC WET Labs Inc Creighton University, NE; University of Nebraska, NE, University of Connecticut Old Dominion University, VA University of Texas, Austin Texas A&M University Areas of study: Chesapeake Bay (2005), Georgia waters near Sapelo Island (2006), Long Island Sound, Peconic Bay NY Harbor, Hudson River (2004-2011), Sandy Hook, NJ (2008-09), Norfolk, VA (2009) Puerto Rico (2004-09), Gulf of Mexico (2010), Florida Keys (2011), Curacao (2012)
Advanced algorithms for retrieval of water parameters Based on our extensive synthetic datasets and field data from our cruises and available NASA field datasets
Bio-optical model and radiative transfer simulation Inherent Optical Properties (IOP) Remote-sensing Reflectance Rrs(λ) Four Components Bio-optical Model Absorption (a) Scattering (b, bb) Algal Particles [Chl] Radiative transfer simulations (Hydrolight) Non - Algal Particles [CNAP] CDOM Particle Scattering Phase Function Varied with particle Concentration & Composition Pure Sea-water Generated as random variables in the prescribe ranges typical for coastal water conditions Specific Chl absorption: combination of pico- and micro-plankton spectra with several weighting factors – Ciotti et al., 2002
Advanced algorithms for retrieval of coastal water parameters • Non-traditional Red/NIR algorithms for Improved Retrievals of chlorophyll concentration in coastal waters Harmful Algal Bloom Retrieval Algorithms Retrievals in West Florida Shelf Using Red Band Difference & Statistical Classifier Optics Express, 2009
Distribution of the fluorescence quantum yield values for two coastal areas of study Mean values are around 0.3-0.5% which is in a good agreement with other authors estimations (Behrenfeld et al.) on the global scale for the open ocean
Comparison of RBD and Statistical classifier with in-situ data Both good matches
Tracking of K. brevisBloom in Florida with RBD Technique Animation of the Blooms of 13 Nov – 06 Dec 2004 detected by RBD technique Blooms of 18 Nov – 02 Dec 2004 identified by in-situ measurements 18 Nov 2004 22 Nov 2004 22 Nov 2004 02 Dec 2004 Source: http://tidesandcurrents.noaa.gov/hab/bulletins.html
Advanced algorithms for retrieval of water parameters Retrieval of the inherent optical properties of the ocean using MODIS bands: Neural Network approaches NOAA Collaborator: M. Wang
The structure of NN algorithmand product levels (synthetic datasets-9000 points) • -We used 3 neural networks (NN-I, II, III) to derive a relationship between Rrs and level 1 products based on a simulated dataset representative of all water types. These NN outputs are used to derive bbp(443),aph(443),ag(443),adm(443).(left figure) • -Using NN-IV we derived a relationship between inverted bbp(443),aph(443),ag(443),adm(443), Rrs and [Chl]. This relationship is based on the NOMAD field measurements.(right figure)
Sample Seasonal [Chl], Spring 2003 Algorithm Implementation on Satellite Data- IOPNN[Chl], mg m-3
Advanced algorithms for retrieval of water parameters Utilizing polarization properties of ocean and coastal waters for improved IOP retrievals NOAA Collaborator: M.Wang
How can we use polarization characteristics of light in water? Standard remote sensing signals by definition do not contain information about full scattering b and attenuation c = a + b. DoLPcan be used to retrieve information about these parameters. We show further that attenuation/absorption ratio c/a can be determined from measured DoLP.
Bio-optical model and RT simulations Water molecules CDOM Phytoplankton particles Non-algal particles • Two main properties of the particles needed in order to simulate for natural water environment: • IOPs ( absorption and scattering coefficients) • Microphysical parameters (Phase Matrix of scattering for all stokes components) [I,Q,U,V]T Microphysical parameters Bio-optical parameters Radiative Transfer Simulations Four main constituents assumed in the bio-optical model: Each mentioned particle has inherent optical properties (IOPs) which are related to its concentration IOPs are measured and modeled based on well established formalism Particles also have microphysical characteristics such as, refractive index, size, effective radius
c/a - DOLP relationshipExample of Retrieval process DOP Absorption coefficient PSD(ξ) Inputs Retrieval Algorithm Attenuation coefficient Scattering coefficient Outputs Attenuation and scattering coefficients can be retrieved from DOP measurements A prior knowledge of PSD and absorption coefficient is needed for retrieval. Establishing an algorithm for the retrieval process.
Present polarimeter incorporating thrusters & polarization camera FULL STOKES POLARIZATION CAMERA DATA LOG & STEPPER MOTOR THRUSTERS HYPERSPECTRAL RADIOMETERS (0°, 45°, 90°, LH CP) 135°
Hydrodynamic modeling for coastal waters • High resolution modeling of Long Island Sound flow Mesh has 50 m resolution or less along NY side line – modeling, dot -- measurement Distribution in the LISCO area
Hyperspectral Remote Sensing of Shallow Coastal Environments PI: Roy A. Armstrong, Ph.D. Student: William Hernandez (Doctoral Candidate) Bio-optical Oceanography Laboratory University of Puerto Rico at Mayaguez (UPRM)
Develop multi-sensor approaches that combine active (LIDAR) and passive airborne hyperspectral (AVIRIS) imagery for retrieval of benthic composition and community structure in La Parguera, Puerto Rico. • Develop an empirical relationship between LIDAR reflectivity and bottom albedo. • Develop algorithms using HICO data to derive water quality parameters in southwestern Puerto Rico.
Validation of ocean color satellite data using LIS Coastal Observatory and coastal in-situ measurements Evaluation of VIIRS ocean color data using measurements from the AERONET-OC sites NOAA Collaborators M. Wang, M. Ondrusek, P. DiGiacomo
Background • The Suomi National Polar-orbiting Partnership (NPP) spacecraft was successfully launched on October 28, 2011 bearing several Earth observing instruments, including the Visible-Infrared Imager Radiometer Suite (VIIRS). . • VIIRS OC products are being distributed as evaluation products for assessment by the NPP Science Team and the research community. • We analyzed the quality of the VIIRS products estimated through the OC processing, namely the normalized water-leaving radiances (nLw) and atmospheric products (i.e., aerosol optical thickness (τa)and Angstrom exponent (γ)), for typical coastal waters conditions encountered at LISCO and WaveCIS AERONET-OC sites. • With statistical analysis carried out between the VIIRS, MODIS and AERONET-OC data, the impacts of the different processing schemes, NASA’s initial and version 2012.2, as well as NOAA’s Interface Data Processing Segment (IDPS), on the VIIRS’s OC data retrievals are assessed. .
Processing schemes • NASA is deriving a continuous temporal calibration based on the on-board calibration measurements for the visible bands, and then reprocessing the full mission to produce a continuously calibrated sensor data record (SDR) product. • In addition, the Ocean Biology Processing Group (OBPG) applies an additional vicarious calibration during SDR to OC Level-2 processing. • In the initial processing (VIIRSinitial), the vicarious calibration reference was derived from a sea surface reflectance model and a climatology of chlorophyll-a concentration. • In the 2012.2 reprocessing (VIIRS12.2), the vicarious calibration is based on measurements from the Marine Optical Buoy (MOBY) near Lanai Hawaii (the same reference is currently used for SeaWiFS and MODIS). • In parallel with the NASA processing schemes, NOAA’s Interface Data Processing Segment (IDPS) provides all VIIRS operational data products including ocean color data. • IDPS processes VIIRS along with other JPSS related sensor data to provide Environmental Data Records (EDR). • IDPSsystem has been progressively developed to ensure the production of atmospheric and environmental products that meet strict accuracy and precision requirements, and it has gained beta status for evaluation.
AERONET-Ocean Color AERONET – Ocean Color: is a sub-network of the Aerosol Robotic Network (AERONET), relying on modified sun-photometers to support ocean color validation activities with highly consistent time-series of LWN() and a(). Data of the LISCO & and WaveCIS sites are used in this study. LISCO WaveCIS Rationale: • Autonomous radiometers operated on fixed platforms in coastal regions; • Identical measuring systems and protocols, calibrated using a single reference source and method, and processed with the same code; • Standardized products of normalized water-leaving radiance and aerosol optical thickness. G.Zibordi et al. A Network for Standardized Ocean Color Validation Measurements. Eos Transactions, 87: 293, 297, 2006.
AERONET-OC sites used in this presentation • AERONET-OC standard multi-spectral SeaPRISM instrument • Measurement sequences are executed every 30 minutes 12:00 PM ±4 hrs of local time • at OC bands: 413, 442, 491, 551 & 667nm. • The Long Island Sound Coastal Observatory (LISCO) • Locate at approximately 3 km from the shore of Long Island near Northport, NY, USA. • Particulate backscattering coefficient at 551 nm is in the range of 0.01 to 0.03 m-1. • Total absorption coefficient at 442 nm varies from 0.38 to 1.2 m-1. • The absorption due to Colored Dissolved Organic Matter (CDOM) at 442 nm is typically close to 0.4 m-1 and in few cases can be as high as 1 m-1. • The WaveCIS site • Locate at approximately 18 km from the shore of Timbalier Bay area, MS, USA. • Particulate backscattering coefficient at 551 nm for WaveCIS water is usually around 0.01 m-1 but, in some rare cases, it reaches up to 0.04 m-1. • Unlike LISCO water, total absorption of the water body is low with its seasonal average value equal to 0.31 m-1 at 442 nm of which ~0.15 m-1 is attributed to CDOM.
LISCO site Characteristics Platform: Collocated multispectral SeaPRISM hyperspectral HyperSAS instrumentations Since October 2009 LISCO Tower Instrument Panel Retractable Instrument Tower 12 meters 27
SeaPRISM instrument LISCO Instrumentation HyperSAS Instrument • Sea Radiance • Sky Radiance • Downwelling Irradiance • Linear Polarization measurements • Hyperspectral: 180 wavelengths [305,900] nm • Sea Radiance • Direct Sun Radiance and Sky Radiance • Bands: 413, 443, 490, 551, 668, 870 and 1018 nm Data acquisition every 30 minutes for high time resolution time series 28
Technical Differences between HyperSAS and SeaPRISM Two Geometrical Configurations Instrument Set Up Looking Down on Instruments Instrument Panel HyperSAS SeaPRISM
Satellite Validation Data filtering procedures for matchup comparisons VIIRS & MODIS images over the regions of the sites Level 1.5 in-situ AERONET-OC data 3×3 pixel box for matchup comparison ±2 hour time window of the satellite overpass time Quality check with flag conditions Exclude the data with high temporal variability Correlation coefficient (R), Average Percent Difference (PD) & Absolute Average Percent Difference (APD) Exclusion of any pixel flagged by the NASA data quality check processing • Land & Cloud • stray light contamination • Atmospheric correction failure • sun glint contamination • reduced or bad navigation quality • negative Rayleigh-corrected radiance • θv > 60°, • θs > 70° • negative value in any one of the wavelengths
Time series of normalized water leaving radiance, nLw(λ),for WaveCIS site • Strong temporalagreement between the satellites and in-situ data. • Seasonal variations in the nLw data are captured well.
Time series of normalized water leaving radiance, nLw(λ),for LISCO site • Strong temporalagreement between the satellites and in-situ data at the 551 & 668 nm wavelengths. • Seasonal variations in the nLw data are also captured well. • Data availability is lower for LISCO mostly due to exclusion of the pixels with atmospheric correction failure and presence of negative values in water leaving radiance especially at violet (413 nm) and blue (442 nm).
nLw spectral consistency analysis Matchup nLw average average ± 1std WaveCIS LISCO • Variation ranges of match-up spectra, and their averages & standard deviations indicates qualitative agreement between the satellites and in-situ nLwdata for both sites. (LISCO lower absolute values (CDOM) WaveCIS generally more sediments from delta outflows) • Average values and spectral shapes are also very consistent.
nLw Spectral consistency analysis • Histograms of nLw(λ) data of VIIRSinitial, VIIRS12.2 and SeaPRISM. • Overall average nLw spectra calculated from all available spectral data of the entire VIIRS operational period are also shown. • WaveCIS • Frequency distributions of the VIIRS12.2match better the SeaPRISMdistributions for all wavelengths than does VIIRSinitial. • Inconsistent spectral shape in the blue part is observed for average VIIRSinitial. • Retrievals appear to be enhanced with the new vicarious calibration gains (from MOBY). • LISCO • VIIRS data for both processing skew to left at every wavelengths suggesting overall underestimations. • Nevertheless, average nLw spectra closely match to SeaPRISM in spectral shapes, values and ranges. • This demonstrates validity of VIIRS data in a qualitative sense as well as usefulness of the AERONET-OC sites for validation purpose. VIIRS12.2 WaveCIS SeaPRISM VIIRSinitial LISCO
Matchup comparison analysis between the nLw(λ) data of satellite and AERONET-OC for WaveCIS site • Very high overall correlation between satellite and SeaPRISM data. R values for comparisons at each wavelength range from 0.92 at 412 nm to 0.987 at 491 nm with VIIRSinitial. • VIIRS12.2is slightly underestimated in terms of SeaPRISM. Conversely, overestimation is observed in VIIRSinitial. • MODIS exhibits similar regression lines with that of VIIRSinitial, nevertheless few outliers exist at 413 and 442nm wavelengths. • Larger R values obtained for both VIIRS datasets compared with MODIS data may probably suggest VIIRS’s superior performance. • Overall percent difference PD values are -6.25 and 13.8 for VIIRS12.2 and VIIRSinitialcomparisons respectively. Therefore, it can be concluded that with the new processing scheme retrieval bias is reduced compared to initial one.
Matchup comparison analysis between the nLw(λ) data of satellite and AERONET-OC for LISCO site • Very high overall correlation coefficient (R) values between the satellite and SeaPRISM data. • With VIIRSinitial R values are equal to 0.8618, 0.9361 and 0.8276 at 491, 551 and 668 nm, respectively. • However, at 442nm only moderate correlation is attained with its R value equal to 0.5832. The degradation in the correlation is more likely to originate from the data processing rather than sensor’s characteristics. • This conclusion is based on the strong R value achieved at 668nm wavelength. It should be also noted here that signal to noise ratio (SNR) of VIIRS sensor is higher at 442 nm (SNR ≈ 490) than at 668 nm (SNR ≈ 378). • With VIIRS12.2, underestimations are further exacerbated to -26% from 22% with VIIRSinitiaon spectral average.
Matchup comparison analysis between the nLw(λ) data of VIIRS and MODIS for WaveCIS and LISCO sites • Strong consistency between MODIS and VIIRS. R ≈ 0.745 at 412nm and ≈ 0.994 at 551nm. • With VIIRSinitialuncertainty between MODIS and VIIRS is very low with APD equal to 3.9% at 551nm for LISCO site. • However, at 412nm APD is as high as 50%. • Data processing procedures need to be improved for the consistent and accurate retrievals. • Additional VIIRS to MODIS cross-calibration can be advocated for more consistent OC data records.
Preliminary assessments of the VIIRS IDPS nLw(λ) data for WaveCIS site Matchup nLw average average ± 1std • As the processing system continue to evolve, we made initial assessments with a view for assisting the development of processing system for better retrieval of ocean color data especially in coastal zones. • spectral variation ranges of the in-situ SeaPRISM and satellite data are consistent with one another. • Nevertheless, the overall average spectral shapes are notably different: thus average nLw spectrum of VIIRSIDPS exhibits a pronounced higher value at 551 nm. • VIIRSIDPS underestimate at every wavelength except 551 nm, where the overestimation PD value is 7.4%. Overall, VIIRSIDPS underestimates about 13%. • Correlations between the VIIRSIDPS and SeaPRISM range from R= 0.81 at 412 nm to ~0.98 at 551nm.
VIIRS IDPS nLw(λ) data for LISCO site SeaPRISM (plotted in red) and VIIRSIDPS(blue)of the LISCO site for March 8th (1st column), March 14th (2nd column), June 10th and September 30th of 2012. • For the LISCO site, out of 32 VIIRSIDPSspectrums, after applying filtering for : the land, high sensor & solar zenith flag conditions, only 4 passed the filtering standard that is applied to all the satellite data throughout this paper. • This is mostly due to issues related to the masking of the pixels with fill values for specific reasons (e.g., edge of swath, exclusion of coastal areas). • These issues have been identified and are being progressively resolved by the ocean color EDR team. • Note that requirements for the IDPS system do not specify the retrieval of ocean color data for coastal and in land waters. • Although data availability is low, the observed consistencies exhibit the potential of the IDPS system for the data retrievals of coastal areas.
Evaluations on the retrievals of atmospheric parameters Qualitative analysis of Angstrom (γ) coefficient distributions MODIS SeaPRISM VIIRSinitial LISCO WaveCIS • Retrieval accuracy of γ is a good indicator of the quality of atmospheric correction process. • γ distributions suggest satellite retrievals for the location are underestimated. • On average satellite retrieved γ values are about 0.66 (LISCO) & 0.34 (WaveCIS) lower than those retrieved from SeaPRISM. • Brookhaven (located in Long Island) and COVE (in Chesapeake Bay), show similar trends. • This probably resulted from the limited set of aerosol models used for atmospheric correction, missing extra fine mode typical of coastal areas. • It is also possible that it is at least partially results from the iterative procedures in the atmospheric correction process in the estimation of the aerosol components in the atmospheric radiance of NIRregion which assumes dark pixels in NIR in initial estimation before proceeding with correction, incorrect for coastal regions with higher suspended particulates.
Evaluations on the retrievals of atmospheric parameters Matchup comparisons between the VIIRS and AERONET aerosol optical thickness (τa) at 442nm & 870nm • Strong correlation coefficient values suggest variations in τa data can be captured well by VIIRS. • Overestimations in VIIRS retrieved τavalues are observed for both sites. For WaveCIS, PD values are 28% and 105% at 442nm and 870nm respectively. For LISCO, 38% and 108%. • Relatively higher PD values at 442nm for LISCO site might be at least partially explained by the mismatch between the γ distributions of VIIRS and SeaPRISM data which in turn suggest possible inadequate aerosol (fine) mode selection for VIIRS. • Validation study carried out for MODIS data based on the data of other coastal AERONET-OC sites (AAOT, GLT & HLT) had also displayed such discrepancy [Zibordi et. al 2009].
Evaluations on the retrieval of atmospheric parameters Matchup comparisons between the MODIS and AERONET aerosol optical thickness (τa) at 442nm & 870nm • MODIS retrieved τa values are also overestimated for WaveCIS and LISCO sites as in the case of VIIRS. • Nevertheless, overestimations in MODIS retrieved τa values are much less than those observed for VIIRS. • PD values are 9% and 37% at 442nm and 870nm respectively for WaveCIS site and 25% and 44% for LISCO site. • VIIRS and MODIS data are processed with the same processing procedure. In addition, γ distributions observed for these two sensors closely match to each other for both sites. Yet retrieval biases are much less with MODIS than VIIRS. • Therefore these significantly larger PD values observed for comparisons between VIIRS and in-situ SeaPRISM τaare may originate from the uncertainties in the absolute radiometric calibration of the space sensor in 862nm band of VIIRS.
Summary • VIIRS sensor can capture well the seasonal and temporal variations in the water leaving radiance field of typical coastal locations used in the study. • Impacts of the vicarious gain change on sensor radiance data in retrieving nLw data is not the same for the two locations with different water properties. • These considerations probably suggest the need to take into account comparisons between AERONET-OC and satellite data for coastal sites before making decisions on changes of sensor gains. • Strong consistency is shown between the time-series nLw data retrieved from the VIIRS and MODIS sensors. • Initial assessments of the IDPS output of the VIIRS shows that, with the processing, water-leaving radiance at 551 nm are slightly overestimated, while for all other wavelengths they are underestimated. • Observed consistencies between the SeaPRISM and VIIRSIDPS data demonstrates the potential of the IDPS system for the data retrievals of coastal areas. • Spectral behavior of the aerosol optical properties may not be fully incorporated, resulting in underestimated VIIRS retrieved Angstrom exponent values, possibly indicating the failure of the current atmospheric correction procedure to include extra fine mode aerosols. • Both VIIRS & MODIS overestimate aerosol optical thickness retrieval. Yet retrieval biases are much less with MODIS than VIIRS. • Therefore the significantly larger PD values observed for comparisons between VIIRS and in-situ SeaPRISM τaprobably originate from the uncertainties in the absolute radiometric calibration of the space sensor in the 862nm band of VIIRS.
Validation of ocean color satellite data using LIS Coastal Observatory and coastal in-situ measurements BRDF model for coastal waters NOAA Collaborator: M. Wang Applied Optics, 2012
Correction for Bidirectional Reflectance Distribution • Adjust the remote-sensing reflectance for • Hypothetical configuration of : • Nadir Viewing • Sun at zenith Above water radiometer Water Body • Radiance emerging from the sea, in general, is not isotropic. • Varies directionally depending on viewing and illumination conditions. • Bi-directionality property depends on Inherent Optical Properties (IOP) of the water constituents which are highly variable, especially in coastal environment. • This bidirectional effect needs to be corrected to get standardized parameters suitable for : Oceanic and Coastal waters monitoring & Calibration-validation of ocean-color satellite data • Current standard BRDF correction algorithm [Morel & Gentili 2002 et. al] : • Optimized for the open ocean water conditions. • Correction is based on the prior estimation of chlorophyll concentration. • But, inappropriate for typical coastal waters usually dominated by sediment or by colored dissolved organic matters (CDOM)
Features of the LISCO site Unique Capability of Making Near-Concurrent Water-Leaving Radiance From Different Viewing Geometries N Instrument Panel W • Both instrument makes measurements with viewing angle, θv = 40o. • Thanks to the rotation feature of SeaPRISM, its relative azimuth angle, φ, is always set 90o with respect to the sun (resulting in water scattering angle range of 132 ~ 145o). • HyperSAS instrument is fixed pointing westward position all the time, thus φ is changing throughout the day and resulting scattering angle range from 110 -175o. • LISCO site instrumentations configuration permits to assess accuracy of the bi-directionality correction of the water leaving radiances. HyperSAS SeaPRISM