Download
1 / 44
440 likes | 446 Views
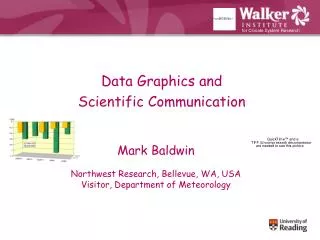
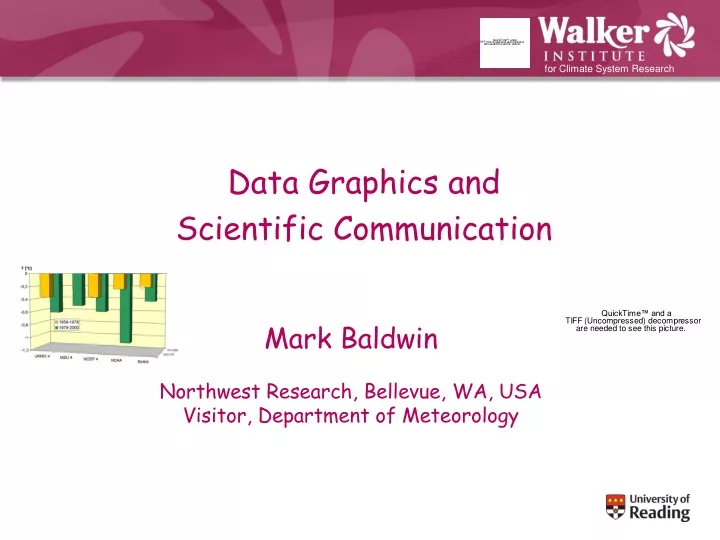
for Climate System Research. for Climate System Research. A very interesting talk. Data Graphics and Scientific Communication. Mark Baldwin Northwest Research, Bellevue, WA, USA Visitor, Department of Meteorology.

E N D
for Climate System Research for Climate System Research A very interesting talk Data Graphics and Scientific Communication Mark Baldwin Northwest Research, Bellevue, WA, USA Visitor, Department of Meteorology
How should you judge whether your typographic choice (e.g., type, type size, leading, number of columns) is a good one? a) You judge whether it looks appealing b) You base your decision on studies of reading comprehension
Justified Is the stratosphere important for predicting changes in weather and climate? Although the role of the stratosphere has not been emphasized until recently, observations and models both indicate that the stratosphere acts to integrate high-frequency forcing from below, with long-lasting feedback effects. Ragged right Is the stratosphere important for predicting changes in weather and climate? Although the role of the stratosphere has not been emphasized until recently, observations and models both indicate that the stratosphere acts to integrate high-frequency forcing from below, with long-lasting feedback effects.
Leading Font Size
80 Sans Serif Font
Graphs & Plots Minimize non-data ink No “chartjunk” (e.g., gratuitous 3-D) Avoid lying with data Bank to 45º Edward R. Tufte
Maximize Data-ink; Minimize non-Data Ink • Edward Tufte defines the data ink ratio as: • Data Ink Ratio = (data ink)/(total ink in the plot) • The goal is to make this as large as is reasonable. To do this you: • Avoid heavy grids • Replace enclosing box with an x/y grid • Prune graphics by: replacing bars with single lines, erasing non-data ink; eliminating lines from axes; starting x/y axes at the data values • Avoid over busy grids, excess ticks, redundant representation of simple data, boxes, shadows, pointers, legends.
Proportion Survived Drug A Drug B Drug C
From “The Visual Display of Quantitative Information” by Edward R. Tufte.
Can you see a difference? 6% of the male population can’t. www.vischeck.com
Composite surface maps for high and low AO index. (From Thompson and Wallace, Science 2001) >0.9°C
for Climate System Research A very interesting talk 1) Pay attention to typography 2) Work to improve graphs and plots 3) Avoid “chartjunk” 4) Maximize data ink 5) Avoid visual puzzles 6) Use easy-to-decode color tables 7) See my Web site for references Conclusions