Download

1 / 44
440 likes | 629 Views
PORTFOLIO RISK AND RETIREMENT SAVING . James M. Poterba MIT April 2003 . PENSION SAVING IS CHANGING. U.K.: Increasing Importance of Defined Contribution Plans (About One Quarter of Private Plans) 1986 Social Security Act: DC Plans and Opt-Out from SERPS

E N D
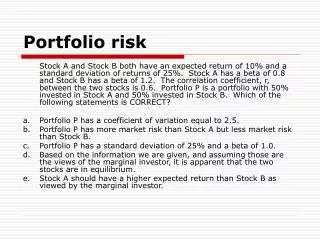
PORTFOLIO RISK AND RETIREMENT SAVING James M. Poterba MIT April 2003
PENSION SAVING IS CHANGING • U.K.: Increasing Importance of Defined Contribution Plans (About One Quarter of Private Plans) • 1986 Social Security Act: DC Plans and Opt-Out from SERPS • U.S.: Rising Importance of Self-Directed Retirement Arrangements
DB vs. DC PENSION PLANS • Defined Benefit Plan: Specifies a Guaranteed Annuity Payout According to a Formula Based on Wages, Years of Service, etc. • Defined Contribution Plan: Payout at Retirement Depends on Value of Assets, Which Depend on Past Employer and Employee Contributions
SHIFTING LANDSCAPE FOR U.S. PENSION SAVING • Rapid Rise in Retirement Assets/Wages (0.5 to 2.5, 1975-99) • 1975: DC Plans Represent About 25% of Participants and Plan Assets • 1980: 64% of Private Retirement Saving Contributions to DB Plans • 1999: 85% of Contributions are to “Individual Directed” Plans, > 50% of Assets in DC Plans
GROWING ROLE OF DC PLANS IN U.K. • 1975: < 2% of Private Sector Occupational Pensions Were DC Plans • 2001: 22% of Private Plans Are DC
WHY THE SHIFT FROM DB TO DC PLANS? • U.K.: DC Plans Can Reduce Employer Costs, Allow Greater “Pension Portability” for Workers • U.S.: Regulatory Changes such as ERISA (1974); Rising Stock Market and Shifting Worker Tastes
COMPARING THE RISKS OF DB AND DC PLANS • DC Plans: Worker Bears Risk of Asset Price Changes, Must Make Investment & Withdrawal Decisions • DB Plans: Worker May Lose Large Fraction of Benefits if Changes Jobs Before Benefits Fully Vest
AVERAGE TENURE ON CURRENT JOB, 1983-1998, US MEN (Friedberg & Owyang)
POLICY ISSUES RAISED BY DC PLAN GROWTH • Accumulation Phase: Should Worker Choice be Restricted? Should There be Guarantees on Returns? What is the Role of Participant Education? • Payout Phase: Should Annuities be Required? Again, What Role for Education?
CURRENT U.S. POLICY DEBATE ON ACCUMULATION • High-Profile Collapse of Firms with Company Stock in 401(k) Plans (Enron, Polaroid) • Weak Stock Market Performance Since 2000 Trimming 401(k) Balances • Links to Policy Debate on Social Security Privatization
ASSET ALLOCATION IN 401(k) PLANS: STYLIZED FACTS • Overall Asset Allocation in DC Plans is Similar to Asset Allocation in DB Plans • About 20% of 401(k) Assets are in Employer Stock • Many Plans Have High Company Stock Holdings
HOW MUCH EMPLOYER STOCK IN 401(k) PLANS? • Most Plans Hold None • Large Plans of Publicly Traded Firms Have Substantial Holdings • Need to Distinguish Employee Allocations vs. Employer Match • Some Saving Plans Were “ESOPs”
INVESTMENT IN COMPANY STOCK: CHOICE OR CONSTRAINT? • Some Investment is Worker Directed -- Workers Decide to Hold Company Stock • Some Investment is Driven by Firm Contributions, Particularly “Matching Contributions” • Do Workers Think About Correlation with Human Wealth?
INVESTMENT DECISIONS OF 401(k) PARTICIPANTS WHO CAN INVEST IN OWN STOCK
HOW RISKY IS COMPANY STOCK? (Mitchell & Utkus) • Ten-Year Average Annual Return on Company Stock (1992-2001): 10.9% • Ten-Year Average Annual Return on S&P 500: 12.9% • Average Standard Deviation of Company Stock Return: 34.4% • Average Standard Deviation of S&P500 Return: 17.3%
PERCEIVED RISKINESS OF DIFFERENT MUTUAL FUND TYPES (John Hancock) • Money Market Funds: 2.4 • Balanced Funds: 2.8 • Company Stock: 3.2 • Stock Funds: 3.6 • International Funds: 4.0
SHARE OF COMPANY STOCK IN FIVE LARGEST DC PLANS • General Electric: 68% (σ = 33%) • Verizon: 38% (σ = 33%) • IBM: 12% (σ = 39%) • General Motors: 21% (σ = 35%) • Lockheed-Martin: 36% (σ = 37%)
FIVE LARGE DC PLANS WITH HIGHEST SHARE OF COMPANY STOCK • Proctor and Gamble: 90% (σ = 37%) • General Electric: 68% (σ = 33%) • Chevron-Texaco: 60% (σ = 28%) • Wells Fargo: 48% (σ = 34%) • SBC Communication: 44% (σ = 35%)
FACTORS THAT AFFECT THE COST OF POOR DIVERSIFICATION • Volatility of Company Stock • Time Profile of Contributions • Other Components of Retirement Income Wealth (SERPS, DB Pension, Private Saving) – Mean and Covariances • Correlation with Human Capital Risk
LIFECYCLE MODEL, UTILITY-BASED APPROACH TO EVALUATING COST OF RISK • Simulate Retirement Wealth for Different Investment Volatilities • Evaluate Expected Utility of Wealth-at-Retirement • Compare with Expected Utility Various Investment Strategies • Translate Into Certainty-Equivalents
EXPECTED UTILITY ALGORITHM Contribution Profile: .10*(Labor Income) Utility of Wealth at Retirement: U(Wret + Wother) = (Wret + Wother)1- /(1-) E(Utility of Retirement Wealth) = EUCompany, EUBonds, EU50-50, EUSP500 Wealth Equivalent: [WESP500]1-/(1-) = EUSP500
SPECIFIC ACCUMULATION ASSUMPTIONS Working Life: 35 Years Starting at Age 30 Contributions = 10% of Wage Earnings Five Investment Options: Index Bonds (1.5% Per Year, Real Return); Large Cap Stocks; Individual Company Stock; Two 50/50 Mixes Calibrate Non-401(k) Wealth at Retirement Based on Health and Retirement Survey
MEDIAN WEALTH AT RETIREMENT, HRS SAMPLE OF SINGLE MEN AGED 66-67 ($2000)
SOCIAL SECURITY, DB, & FINANCIAL WEALTH (RELATIVE TO FINAL EARNINGS)
FINANCIAL WEALTH (EXCLUDING IRAs) RELATIVE TO FINAL EARNINGS
ASSUMPTIONS ABOUT ASSET RETURNS Return on Index Bonds: 1.5% Per Year (Real) Large-Cap Stock Returns: Empirical Distribution, 1926-2001; Mean Real Return = 9.4%, Annual Standard Deviation = 20.2% Individual Company Stock Return: Mean = 9.4%, Standard Deviation = 40.4%
DISTRIBUTION OF EQUITY RETURNS, LARGE CAP U.S. STOCKS, 1926-2001
SIMULATION ALGORITHM • Draw Sequence of 35 Annual Stock Returns (and Associated Company Stock Returns) from Empirical Distribution for Actual Returns • Calculate Wealth at Retirement for Each Education Group for Each Sequence • Evaluate Utility of Retirement Wealth • Repeat (300,000 times) • Compute Sample Means as Estimates of Expected Utility • Calculate Certainty Equivalents
100% Bonds 50-50 Bonds/S&P 100% S&P500 50-50 Bonds/Company Stock 100% Company Stock DISTRIBUTION OF 401(k) WEALTH/FINAL EARNINGS, MEN WITH HS DEGREE AND/OR SOME COLLEGE 95 90 85 80 75 70 65 60 55 50 45 40 35 30 25 20 15 10 5 0 60 0 80 120 100 20 40 140
100% Bonds 50-50 Bonds/S&P 100% S&P500 50-50 Bonds/Company Stock 100% Company Stock 401(k) WEALTH/FINAL EARNINGS, MEN WITH HS AND/OR SOME COLLEGE, ONE-STOCK VOLATILITY FACTOR = 1.5 95 90 85 80 75 70 65 60 55 50 45 40 35 30 25 20 15 10 5 0 60 0 80 120 100 20 40 140
CERTAINTY EQUIVALENTS, HS GRADUATES, COMPANY STOCK VOLATILITY = 1.5*MARKET
CERTAINTY EQUIVALENTS, HS GRADUATES, EQUITY PREMIUM REDUCED BY 200 BASIS POINTS
CONCLUSIONS FROM SIMULATIONS • Investments Restricted to Company Stock May be Worth Only Half as Much as Diversified Equity Holding • “Equity Premium Puzzle” Appears: Return to Diversified or Poorly Diversified Equity Portfolio is High • Costs of Non-Diversification Depend on Other Elements of Household Portfolio
KEY CONSIDERATIONS FOR POLICY DESIGN • Do Investors Accurately Perceive Risk-Return Tradeoffs? • Problem of Investor Heterogeneity? Constrain Those Who Make “Plausible” Allocations to Avoid “Risky” Allocations of a Minority?
PUBLIC AND PRIVATE RESPONSES TO LACK OF DIVERSIFICATION • Limitations on Investment Options • Limitations on Asset Allocation – How Frequently “Tested?” • Participant Education by Government or Firm – Any Liability Issues?