Download
1 / 16
160 likes | 165 Views
TFEIP Workshop on Emission Projections Thessaloniki, 30–31 October 2006. Experiences and lessons from GHG emission projections under the Climate Change Convention. Dr. Harald Diaz-Bone UN Climate Change Secretariat Reporting, Data and Analysis Programme e-mail: HDiaz@unfccc.int. Outline.

E N D
TFEIP Workshop on Emission Projections Thessaloniki, 30–31 October 2006 Experiences and lessonsfrom GHG emission projections under the Climate Change Convention Dr. Harald Diaz-BoneUN Climate Change SecretariatReporting, Data and Analysis Programmee-mail: HDiaz@unfccc.int
Outline • Projections and the UNFCCC • Some milestones on UNFCCC projections • UNFCCC reporting guidelines • Some experiences made and lessons learnt • Good practice in reporting on projections • Results of UNFCCC projections workshop • Some fuel for thought
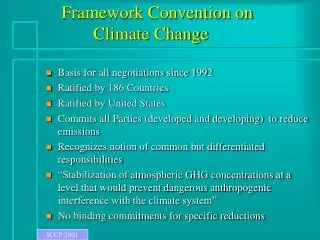
Projections and the Climate Change Convention • Article 2: The ultimate objective of this Convention (...) is to achieve (...) stabilization of greenhouse gas concentrations in the atmosphere at a level that would prevent dangerous anthropogenic interference with the climate system. Such a level should be achievedwithin a time-frame sufficient to allow ecosystems to adapt naturally to climate change (...). • EU Strategy for Sustainable Development: limit global warming to less than 2 °C above pre-industrial levels • IPCC emission scenarios as a basis for policy making • Projections to bridge the gap between today’s action and its future impact
Projections and the Climate Change Convention • Article 4.2:The developed country Parties (…) commit themselves specifically as provided for in the following: • (a) Each of these Parties shall adopt national policies and take corresponding measures on the mitigation of climate change, by limiting its anthropogenic emissions of greenhouse gases and protecting and enhancing its greenhouse gas sinks and reservoirs. (…) • (b) In order to promote progress to this end, each of these Parties shall communicate (…) detailed information on its policies and measures (…), as well as on its resulting projected anthropogenic emissions by sources and removals by sinks of greenhouse gases ().
Projections and the Kyoto Protocol • Article 3.1: The Parties included in Annex I shall, individually or jointly, ensure that their aggregate (…) emissions (…) do not exceed their assigned amounts (…), with a view toreducing their overall emissions of such gases by at least 5 per cent below 1990 levels in the commitment period 2008 to 2012. • EC: For the developed countries as a whole, this 5% target represents an actual cut of around 20% when compared with the emissions levels that are projected for 2010 if no measures are adopted. (http://ec.europa.eu/environment/climat/kyoto.htm) • Article 3.2: Each Party included in Annex I shall, by 2005, have made demonstrable progress in achieving its commitments under this Protocol. • Projections as a tool to show demand and progress in mitigation
Some Milestones on Projections • 1992 Framework Convention on Climate Change • 1997 Kyoto Protocol • 1999 UNFCCC reporting guidelines • 2001/2 3rd national communications of Annex I Parties • 2003 Compilation and synthesis report of NC3s • 2004 UNFCCC workshop on projections (Bonn) • 2004 UNFCCC workshop on NC4s (Dublin) • 2006/7 NC4s and progress reports of Annex I Parties • 2006 Synthesis report on demonstrated progress • 2007 Compilation and synthesis report of NC4s
Some UNFCCC Weblinks on Projections • UNFCCC reporting guidelines, NC3s, compilation and synthesis report of NC3s, UNFCCC workshop on NC4s (Dublin), NC4s and progress reports: http://unfccc.int/national_reports/annex_i_natcom_/items/1095.php • 2004 UNFCCC workshop on projections (Bonn): http://unfccc.int/meetings/workshops/other_meetings/items/3129.php • 2006 synthesis report on reports demonstrating progress: http://unfccc.int/resource/docs/2006/sbi/eng/inf02.pdf
UNFCCC Reporting Guidelines (1) • Purpose: …to give an indication of future trends in GHG emissions and removals, based on the implemented and adopted PaMs, and to give an indication of the path of emissions and removals without such PaMs… • Scenarios: Parties shall report “with measures” (WM) scenarios and may report “with additional measures” (WAM) and “without measures” (WOM) scenarios • Consistency between projections and inventory data (WM and WAM starting point last year of inventory data, 2004; WOM 1990 or 1990) • Coverage • Reporting by sector, consistent with sectors in the PaMs section (energy, transport, industry, agriculture, forestry and waste management) • All six gases, also precursors and SO2; by sector and totals using GWP • Separate reporting on projections on international bunker fuels • Timing: 2005, 2010, 2015 and 2020; sample diagram: fig.1 of the guidelines
UNFCCC Reporting Guidelines (3) • Assessment of aggregated effect of PaMs(or why a WOM scenario is needed) • Effects of individual PaMs are reported in the PAMs section, total effects are reported in projections section (link with PaMs); • Parties shall report the total effect of PaMs • What types of effects: ex-post (for 1995 and 2000) and ex-ante (for 2005, 2010, 2015 and 2020) • How to report (estimate) total effect • Total effect as difference between “with measures “ and “without measures” scenario • Total effects as aggregation of individual effects of each significant PaMs (link with PaMs)
Some Experiences and Lessons Learnt (1) • NC3: Improved reporting (new guidelines and enhanced modeling capacity and human resources) • More Parties provided more than one scenario, but few provided WOM scenario (WM-30, WAM-21, WOM-7) • Good coverage of projections by gas, except for fluorinated gases (HFCs, PFCs, SF6) • Good coverage of projections by sector, except for transport (highest growth!) and forestry (highest uncertainty!) • Projections on int. bunker fuels not always provided
Some Experiences and Lessons Learnt (2) • Several Parties provided only one scenario (~ 10) and in several cases the scenario definitions did not follow the guidelines (~ 6) • Reporting of information by sector and by gas was not always transparent and consistent within individual NCs (and not easily comparable across different NCs) • Some inconsistencies between projections and inventories or PaMs (not the same set of PaMs or total effects are different) • Limited reporting on models, their attributes and sensitivity analysis • Description of key assumptions not always transparent, not always clear what triggered changes in key assumptions compared to previous NCs • Limited analysis of results and impacts of key drivers
Examples of Good Practice • Reporting on all 3 scenarios (BUL, CAN, FRA, ITA, JPN, SVK) • Consistency between reporting by gas and sector and in line with IPCC categories: Denmark • Concise, but clear description of the model and key assumptions: Australia, Bulgaria, Canada, the Netherlands • Interpretation of the results and impacts from key assumptions/drivers; Finland (changes in GDP, energy efficiency improvement, impacts from new technologies), Australia (attribution of the overall effect from PaMs to different sectors) • Clearly explained changes between projections reported in the NC2 and NC3: the U.K. • Sensitivity analysis: Australia, Canada, New Zealand, Sweden, United States • Uncertainty analysis using the Monte Carlo method: the Netherlands
Some Fuel for Thought • What is the role of different scenarios (WM, WOM and WAM) and why it is important to report on more than one scenario following the guidelines definitions on these scenarios? • How to ensure transparency and consistency in reporting of information by sector and by gas (table from the projections workshop)? • How to ensure consistency in reporting on projections with inventories and policies and measures sections of the national communication (IPCC categories, table from projections workshop, total and individual effect from PaMs)? • How to provide clear, but concise description of models and key assumptions (explanation on the changes in key assumptions)? • How to improve the reporting on the analysis of results from projections, e.g. the impact from key assumptions and drivers, and policies and measures? • Sensitivity analysis: is it just a reporting requirement or a useful tool to facilitate transparency in assessment and reporting in the NCs, if such analysis is used, how to report on it?