Download
1 / 44
440 likes | 564 Views
AP3A90/APMA90 Climate Change and Food Systems. Observations and projections of climate change. Dan Hodson d.l.r.hodson@reading.ac.uk. Observations and projections of climate change. By the end of this lecture you should be able to engage in a discussion about:

E N D
AP3A90/APMA90 Climate Change and Food Systems Observations and projections of climate change Dan Hodson d.l.r.hodson@reading.ac.uk Observations and projections of Climate Change
Observations and projections of climate change By the end of this lecture you should be able to engage in a discussion about: • The Observations of a changing Climate. • Climate modelling and Projections of future Climate Change • Uncertainty in Climate modelling and projection. Observations and projections of Climate Change
What is Climate? Maldives to be Warm Antarctica to be Cold Atacama Desert Dry Bergen Wet “Climate is what you expect, Weather is what you get”. Climate is the statistics of weather, e.g. the average of weather conditions over some period of time. Expect : Observations and projections of Climate Change
What is the Climate System? Ice Atmosphere Land Ocean Vegetation Observations and projections of Climate Change
Observations of Climate Change Observations and projections of Climate Change
Climate Change • Climate can be defined as the average of weather. • Climate is what we Expect. • A Change in Climate means e.g. a change in the average weather conditions & change in what we expect e.g.: • Warmer summers • Wetter winters • But also can talk about the Climate in terms of other system components e.g. • The height of the sea. • The number of forest fires each summer. Observations and projections of Climate Change
Observing the Weather • People have always watched and noted the weather, but Objective measurements using scientific instruments began only ‘recently’: • Thermometers around since 1600’s • Early 1700’s Daniel Gabriel Fahrenheit manufactured first reliable mercury thermometers. • The Central England Temperature record is the Oldest instrumental record of temperature in the world. • Monthly measurements back to 1649. Observations and projections of Climate Change
CET Observations and projections of Climate Change
Observing the Weather • Observations continued in this uncoordinated way for many years. • Individual Weather diaries • Marine weather logbooks • Once weather forecasting began, it was realised that coordinated, reliable, regular measurements of the weather were required. • World Meteorological Organisation (1950) set up to coordinate this observation across the World. Observations and projections of Climate Change
Global Observing Network Locations of land, ship and buoy observations across the world at 6am 14 January 2008 Land observations concentrated in inhabited areas and mainly in the Northern Hemisphere 1970 Observations and projections of Climate Change
Has the Earth Surface Warmed? Different estimates (smoothed) ~ 0.8ºC IPCC AR4 Observations and projections of Climate Change
Is the rate of warming increasing? IPCC AR4 Observations and projections of Climate Change
Global Trends Temperature trends at each point on the Earth IPCC AR4 More warming over land than oceans Some regions have cooled. Observations and projections of Climate Change
The ten warmest years on record • 1998 • 2010 • 2005 • 2003 • 2002 • 2009 • 2004 • 2006 • 2007 • 2001 • Nine of these are from the last decade • All are from the last 13 years • 1998 • 2005 • 2003 • 2002 • 2009 • 2004 • 2006 • 2007 • 2001 • 1997 • Eight of these are from the last decade • All are from the last 13 years (Data taken from the Hadley Centre) Observations and projections of Climate Change
Is it unusual? Global average temperature rose in the 20th Century Is this unusual? Have temperatures changed like this in the past? Problem: Very few temperature measurements before 1900. How can we measure temperatures before the invention of the thermometer? Natural Thermometers! Observations and projections of Climate Change
Tree Rings Trees grow outwards and lay down a new ring of wood every year. More vigorous growth = thicker ring. Growth dependent on temperature, rainfall etc. Can estimate temperature from the width of rings. ~1000 years. Observations and projections of Climate Change
Estimates of past Northern Hemisphere Temperature Recent warming unprecedented IPCC AR4 Observations and projections of Climate Change
Have other things changed? Arctic Sea Ice Area Glacier Lengths Sea level height Observations and projections of Climate Change
Have other things changed? Three Estimates of the Amount of heat in the upper ocean. Oceans are Warming: Observations and projections of Climate Change
Greenhouse Gases? Carbon Dioxide (CO2) Nitrous Oxide (N2O) Methane (CH4) Observations and projections of Climate Change
Ice Cores Ancient gases trapped in bubbles in Antarctic Ice. Can recover ice & gases that have been stored for 10 000s of years. Can measure levels of Greenhouse gases in Ancient atmosphere. Observations and projections of Climate Change
Unprecedented? IPCC AR4 Rate of increase of greenhouse gases unprecedented in last 20 000 years. Observations and projections of Climate Change
Observations of Climate Change: Summary • Many 1000s of measurements form estimate of changing climate. • Global average (mean) surface temperature rose by ~0.8ºC during the 20th Century. • 9/10 of the last 10 years were the warmest on record globally. • These warm temperature are likely highest in the past ~1000 years. • Also • Sea level & Upper ocean heat content rose • Arctic sea ice and Glaciers melted • Concentrations of Major Greenhouse gases risen over 20th Century. • Largest seen in last 20 000 years. Observations and projections of Climate Change
Modelling the Climate Observations and projections of Climate Change
Climate System Components Ice Atmosphere Land Ocean Vegetation Observations and projections of Climate Change
Why? • Why do we need a model of the Climate System? • Most of Experimental Science • Take some part of the World. • Make some change. • Measure any Effect. • The Climate System is the World. • Can’t do real experiments on the Whole Climate System. • Need Climate Models. Observations and projections of Climate Change
Modelling the Climate System Physics Do experiments to find out how Climate components (e.g. water) behave. Write down a mathematical description of this behaviour. Convert this into a numerical form for use in a computer. Can then use model Earth climate to perform experiments not possible with the real Earth Climate. Observations and projections of Climate Change
Is the model Correct? Annual Rainfall Real World Model IPCC AR4 • If we use our Climate Model to simulate 20th Century climate we can compare to our past measurements of the real 20th Century climate. • Model Validation Observations and projections of Climate Change
Is the model Correct? • Models simulate some variables better than others. • Temperature is predicted accurately • Rainfall less so • Climate models reproduce many of the features of the real climate • Global Patterns temperature & rainfall • Seasonal retreat of ice caps • North Atlantic Gulf Stream these are not explicitly built into the model, they emerge from the physics. • More confidence that models are reliable. Observations and projections of Climate Change
Two Experiments • EXPT1: Use our climate models to simulate 20th Century climate as it was. • Known Increases in Greenhouse gases • Known changes in Natural Forcings • Volcanoes • The slight variations of light from the Sun. • EXPT2: Use our climate models to simulate 20th Century climate as it might have been • No changes in Greenhouse gases • Known changes in Natural Forcings Observations and projections of Climate Change
Results IPCC AR4 • EXPT1: Greenhouse gases + Natural Forcings. • Black line: measured 20th Century Global average Temperature. • Red Line: Average of same experiment with many different climate models. • EXPT2: Natural Forcings Only. • Implication: Increases in Global average Temperature due to increases in Greenhouse gas emissions. Observations and projections of Climate Change
Projections of future Climate Change Observations and projections of Climate Change
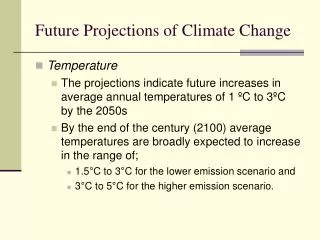
Projected global temperatures • A2/A1B/B1 – different estimates of future GHG emissions. • A2 = High Emissions • B1 = Low Emissions • Large range by end of century. • Some warming even if we stopped emitting all GHG today. Observations and projections of Climate Change
Projected regional temperature changes 2090-2099 B1 (low) A2 (high) IPCC AR4 • Northern latitudes warm more. • Melting sea ice – feedbacks • Land warms more than oceans. Observations and projections of Climate Change
Projected regional Rainfall Changes 2090-2099 Northern Winter Northern Summer • Different regions show different rainfall changes. • Northern high latitudes: increased rainfall in N. Hemisphere winter. • Wetter, more flooding. • Southern Africa & Mediterranean reduced rainfall in N. Hem. Summer • Drier, more droughts. • Grey shading – regions where we are confident. Observations and projections of Climate Change
Extremes • 2003 European heatwave • Probably hottest EU summer in last 500 years. • Stott et al (2004) likely to be considered a cool summer in 2100. These are projections of the increase in the average temperatures and rainfall. If the average temperature increases, then the chance of heat waves occurring increases. Observations and projections of Climate Change
Uncertainty in Climate modelling and projection. Observations and projections of Climate Change
Climate Projections: Sources of Uncertainty In Science it’s important to know what you don’t know. Three sources of uncertainty in climate projections: • Uncertainty in future Greenhouse gas levels (Scenario Uncertainty) • Uncertainty in the formulation of the Climate models (Model Uncertainty) • Intrinsic uncertainty in the climate system. (Internal Variability) Observations and projections of Climate Change
Scenario Uncertainty Emissions Scenarios IPCC,2000 • We don’t know what future Greenhouse gas emissions will be. • Produce ‘Scenarios’ – estimates of future emissions based on estimates of future • Population Projections • Economic Development • Structural and Technological Change • Vary from High growth (A1) to Low growth (B2). Observations and projections of Climate Change
Model Uncertainty Climate models are only approximate models of the real world. • They have low resolution • A region of 200km x 200km represented by a single point. • They cannot represent small scale processes directly • Formation of rain represented by statistical rather than physical model. • They cannot include all processes in the Climate System • Ocean biology, Dynamic vegetation, Agriculture, Economics are only just beginning to be included. • There are many Climate models (17 used in last IPCC report) Observations and projections of Climate Change
Intrinsic Uncertainty (Internal Variability) • Butterfly effect. Sensitivity to the initial conditions. • Because we do not know the exact state of the Climate system now, we cannot predict the exact future state of the climate. If we start our Climate model and watch how the temperature evolves. If we start the model again, but from a slightly different point The temperature evolves differently. Observations and projections of Climate Change
Working with uncertainty • Although these sources of uncertainty exist we can assess and quantify the scale of uncertainty. • This allows us to assign a level of confidence to climate projections. • This allows the IPCC AR4 to say: • “Most of the observed increase in global average temperatures since the mid-20th century is very likelydue to the observed increase in anthropogenic greenhouse gas concentrations”. Observations and projections of Climate Change
Summary In this lecture we have discussed: • The Observations of a changing Climate. • Climate modelling and Projections of future Climate Change • Uncertainty in Climate modelling and projection Observations and projections of Climate Change
Next Lecture The next lecture: The climate system and the IPCC March 3rd • Examine the Climate System in detail • Discuss the mechanisms for a changing climate • Discuss the IPCC & Kyoto Protocol • Dan Hodson • d.l.r.hodson@reading.ac.uk Observations and projections of Climate Change