Download
1 / 16
160 likes | 239 Views
Warm Up. Generate ordered pairs for the function y = x + 3 for x = –2, –1, 0, 1, and 2. Graph the ordered pairs. ( – 2, 1) ( – 1, 2) (0, 3) (1, 4) (2, 5). Linear, Quadratic, and Exponential Models. Compare linear, quadratic, and exponential models.

E N D
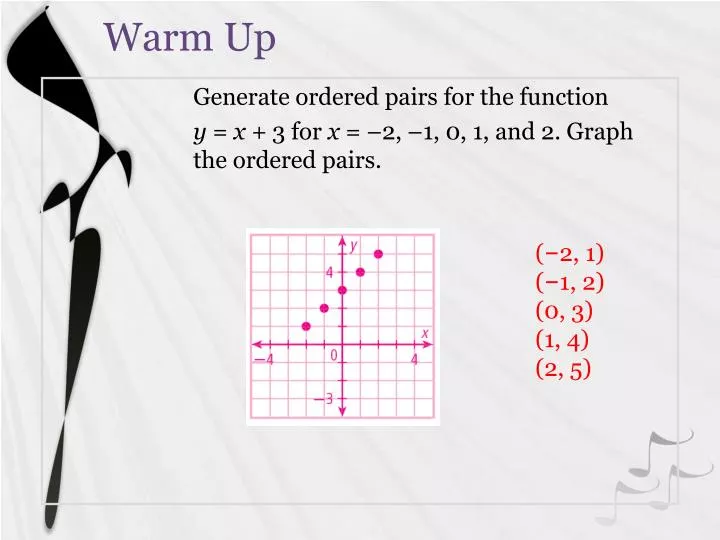
Warm Up Generate ordered pairs for the function y = x + 3 for x = –2, –1, 0, 1, and 2. Graph the ordered pairs. (–2, 1) (–1, 2) (0, 3) (1, 4) (2, 5)
Linear, Quadratic, and Exponential Models Compare linear, quadratic, and exponential models. Given a set of data, decide which type of function models the data and write an equation to describe the function. Objectives
The "Vertical Line Test" Looking at this function stuff graphically, what if we had the relation {(2, 3), (2, –2)}? We already know that this is not a function, since x = 2 goes to both y = 3 and y = –2. If we graph this relation, it looks like: Notice that you can draw a vertical line through the two points, like this: Given the graph of a relation, if you can draw a vertical line that crosses the graph in more than one place, then the relation is not a function. Here are a couple examples:
In the real world, people often gather data and then must decide what kind of relationship (if any) they think best describes their data.
Graphing Data to Choose a Model Graph each data set. Which kind of model best describes the data? Plot the data points and connect them. The data appear to be exponential.
Graphing Data to Choose a Model Graph each data set. Which kind of model best describes the data? Plot the data points and connect them. The data appears to be linear.
Graphing Data to Choose a Model Graph each set of data. Which kind of model best describes the data? Plot the data points. The data appears to be exponential.
Graphing Data to Choose a Model Graph each set of data. Which kind of model best describes the data? Plot the data points. The data appears to be quadratic.
Another way to decide which kind of relationship (if any) best describes a data set is to use patterns.
+ 1 + 64 –32 + 1 + 32 –32 + 1 0 –32 + 1 –32 Using Patterns to Choose a Model Look for a pattern in each data set to determine which kind of model best describes the data. Height of golf ball For every constant change in time of +1 second, there is a constant second difference of –32. The data appear to be quadratic.
1.17 + 1 + 1 1.17 + 1 1.17 Using Patterns to Choose a Model Look for a pattern in each data set to determine which kind of model best describes the data. Money in CD For every constant change in time of + 1 year there is an approximate constant ratio of 1.17. The data appears to be exponential.
+ 1 – 9 + 1 + 6 – 3 + 1 + 6 + 3 + 1 + 6 + 9 Using Patterns to Choose a Model Look for a pattern in the data set {(–2, 10), (–1, 1), (0, –2), (1, 1), (2, 10)} to determine which kind of model best describes the data. For every constant change of +1 there is a constant ratio of 6. The data appear to be quadratic.
After deciding which model best fits the data, you can write a function. Recall the general forms of linear, quadratic, and exponential functions.
Remember! • When the independent variable changes by a constant amount, • linear functions have constant first differences. • quadratic functions have constant second differences. • exponential functions have a constant ratio.
Lesson Quiz: Part I Which kind of model best describes each set of data? 1. 2. quadratic exponential