Download
1 / 9
90 likes | 206 Views
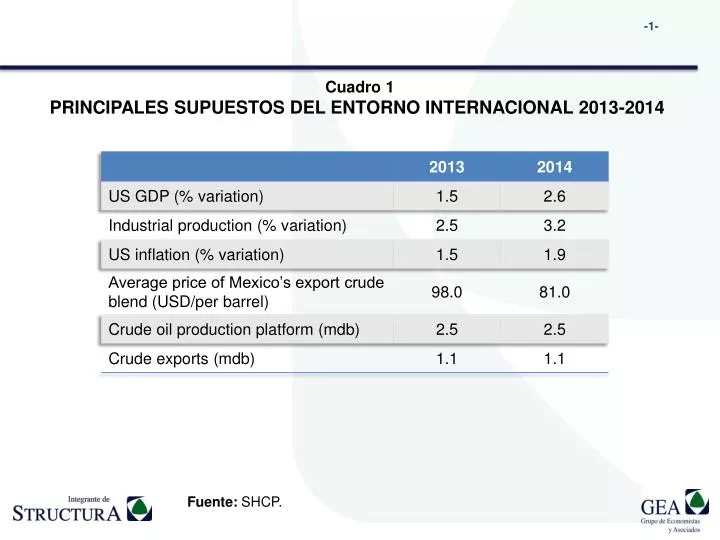
Cuadro 1 PRINCIPALES SUPUESTOS DEL ENTORNO INTERNACIONAL 2013-2014. Fuente: SHCP. Cuadro 2 MARCO MACROECONOMICO DE MEXICO 2013-2014. Fuente: SHCP y estimaciones de GEA. Gráfica 1 ESTIMACIÓN DE LA TRAYECTORIA DEL PIB Y SUS COMPONENTES 2013-2014 (Var % real).

E N D
Cuadro 1 PRINCIPALES SUPUESTOS DEL ENTORNO INTERNACIONAL 2013-2014 Fuente: SHCP.
Cuadro 2 MARCO MACROECONOMICO DE MEXICO 2013-2014 Fuente: SHCP y estimaciones de GEA.
Gráfica 1 ESTIMACIÓN DE LA TRAYECTORIA DEL PIB Y SUS COMPONENTES 2013-2014 (Var % real) Fuente: INEGI y estimaciones de GEA.
Gráfica 2 EVOLUCIÓNDEL GASTO PROGRAMABLE DEL SECTOR PÚBLICO 2000-2014 (Var % real) Fuente: SHCP.
Gráfica 3 TRAYECTORIA DE LOS INGRESOS PRESUPUESTARIOS 2000-2014 (Var % real) Fuente: SHCP.
Gráfica 4 TRAYECTORIA DEL BALANCE PRIMARIO Y EL BALANCE PUBLICO 2000-2014*/ (% PIB) */ Las cifras positivas representan un superávit y las negativas déficit. Fuente: SHCP.
Gráfica 5 ESCENARIOS DE DEUDA DEL SECTOR PÚBLICO (PSBR) 2007-2019 (% PIB) +27.8% to+34.2% Fuente: SHCP.
Gráfica 6 COMPONENTES DE LA DEMANDA DE BIENES Y SERVICIOS ENERO-JUNIO 2013 (Var % real) Effect of new housing policies Effect of reduced public spending Effect of US decelera-tion Fuente: INEGI.
Gráfica 7 TASA DE INTERES INTERBANCARIA MEXICO-EUA(%) 2013 Jan-Aug Spread Overnight interbank lending rate (Mexico) Fed funds rate (US) Fuente: Banxico.