Download
1 / 6
130 likes | 292 Views
Exercise Stress Echo (Pulmonary pressure). Rest. Peak. dPmax = 64 mmHg. dPmax = 110 mmHg. Exercise Stress Echo (Mitral Regurgitation). Rest. Peak. Aliasing velocity = 38.4 cm/s PISA radius = 0.5cm Peak MR velocity = 500cm/s VTI MR = 175cm ERO = 2 x 0.9 2 x 38.4 / 570 = 0.12cm 2

E N D
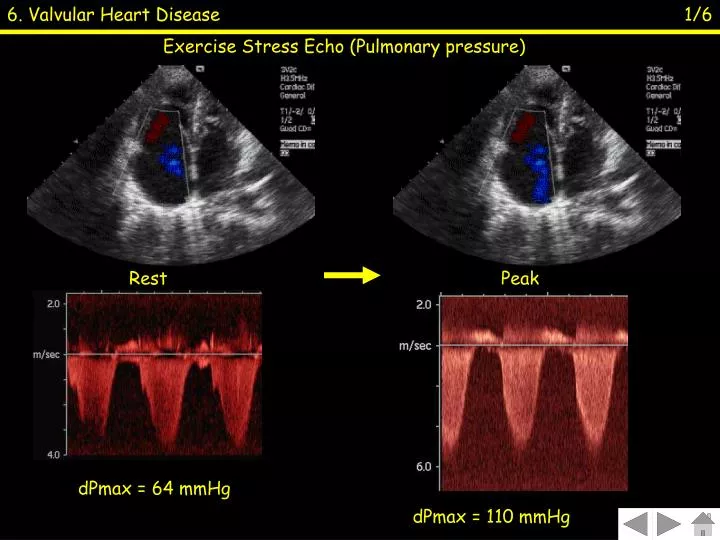
Exercise Stress Echo (Pulmonary pressure) Rest Peak dPmax = 64 mmHg dPmax = 110 mmHg
Exercise Stress Echo (Mitral Regurgitation) Rest Peak Aliasing velocity = 38.4 cm/s PISA radius = 0.5cm Peak MR velocity = 500cm/s VTI MR = 175cm ERO = 2 x 0.92 x 38.4 / 570 = 0.12cm2 Regurgitant volume = 175 x 0.12 = 21ml Aliasing velocity = 38.4 cm/s PISA radius = 0.9cm Peak MR velocity = 570cm/s VTI MR = 195cm ERO = 2 x 0.92 x 38.4 / 570 = 0.34cm2 Regurgitant volume = 195 x 0.34 = 66ml
Dobutamine Stress Echo (True Aortic Stenosis) REST Peak V = 3.5 m/s Mean P = 32 mmHg AVA = 0.7 cm2 DOBUTAMINE Peak V = 4.9 m/s Mean P = 56 mmHg AVA = 0.7 cm2
Dobutamine Stress Echo (Aortic Pseudostenosis) REST Peak V = 3.5 m/s Mean P = 32 mmHg AVA = 0.7 cm2 DOBUTAMINE Peak V = 4.0 m/s Mean P = 36 mmHg AVA = 1.1 cm2
Mitral stenosis MV CW TR CW 2D Color rest peak
dP=36mmHg dP=64mmHg Mitral stenosis 2D Color MV CW TR CW rest dPmean=4mmHg dPmean=9mmHg peak