Download
1 / 44
440 likes | 568 Views
Diagnostics for the ocean model component of coupled hurricane models. Richard M. Yablonsky, Isaac Ginis (URI/GSO) Carlos Lozano, Hyun-Sook Kim, Naomi Surgi (NCEP/EMC) Hurricane Verification/Diagnostics Workshop National Hurricane Center, Miami, FL 5 May 2009.

E N D
Diagnostics for the ocean model component of coupled hurricane models Richard M. Yablonsky, Isaac Ginis (URI/GSO) Carlos Lozano, Hyun-Sook Kim, Naomi Surgi (NCEP/EMC) Hurricane Verification/Diagnostics Workshop National Hurricane Center, Miami, FL 5 May 2009
Storm-core SST reduction • Evaporation from sea surface provides heat • energy to drive the hurricane • Energy decreases if storm-core SST decreases • SST can decrease in the hurricane’s core by: • Vertical mixing/entrainment • Upwelling • Horizontal advection of a surface cold pool • Heat flux to the atmosphere Later… Small by comparison
1) Vertical mixing/entrainment A T M O S P H E R E Wind stress → surface layer currents Current shear → turbulence Turbulent mixing → entrainment of cooler water O C E A N Warm sea surface temperature Sea surface temperature decreases Cool subsurface temperature Subsurface temperature increases This is a 1-D (vertical) process
2) Upwelling A T M O S P H E R E Cyclonic wind stress → divergent surface currents Divergent currents → upwelling Cyclonic hurricane vortex Upwelling → cooler water brought to surface O C E A N Warm sea surface temperature Cool subsurface temperature This is a 3-D process
Are 1-D Ocean Models Sufficient? • Upwelling is neglected in coupled hurricane-ocean models that use a 1-D (vertical) ocean component • Is vertical mixing/entrainment >> upwelling? Vertical mixing/entrainment is assumed to be the dominant mechanism for storm-core SST reduction
A T M O S P H E R E Prescribed translation speed Vmax = ~50 m/s RMW = 55 km < < < < < < < < O C E A N Homogeneous initial SST < < < < Horizontally-homogeneous subsurface temperature What is the impact of varying storm translation speed?
2.4 m s-1 4.8 m s-1 Hurricanes have historically translated in the Gulf of Mexico: < 5 m s-1 73% and < 2 m s-1 16% of the time And in the western tropical North Atlantic: < 5 m s-1 62% and < 2 m s-1 12% of the time So 3-D effects are often important…
3-D 1-D 2.4 m s-1 GCW 3-D 1-D 4.8 m s-1 GCW
3-D 1-D 2.4 m s-1 GCW 60-km 200-km 3-D 1-D 4.8 m s-1 GCW
Validating Storm-Core SST During Coupled Model Forecast • Accurate wind field, including size, shape, & magnitude are required for producing an accurate ocean response, which feeds back to the hurricane via the storm-core SST • Thus the wind field must be validated as part of the ocean model validation • What is the “storm core” radius over which heat flux to the atmosphere is significant for intensity change? • Storm-dependent (e.g. Eyewall; Rmax; 2*Rmax; 34-kt radius)? • Fixed value (60-km; 90-km; 100-km; 150-km; 200-km; 250-km)? • All of these values (& others) appear in the literature and/or are used as diagnostics for coupled models… open question?
Validating Ocean Response • Location/magnitude of hurricane-induced currents • Strongest surface currents to the right of storm track • Inertial oscillation in current field • Location & magnitude of hurricane cold wake • Displaced to the right of the storm track where surface current shear & vertical mixing are maximized • Increased symmetric component of cooling for slow-moving storms due to high impact of upwelling • Also validate salinity & biochemical parameters?
Where do we want measurements? 200-km X X X X X X X X X X X X X X X X X X X X X X X X X X 60-km AXBTs are good… AXCPs (AXCTDs) are even better because currents (salinity) can be measured along with temperature… See Shay and Uhlhorn (2008, MWR): Isidore and Lili (2002) Sea Surface Temperature (°C)
Requirements for model validation • Future track of hurricane core is key region for validation of initial conditions • In regions with weak horizontal variability (e.g. the Sargasso Sea), a few in situ measurements (e.g. floats and drifters) with low spatial resolution are sufficient to validate initial field • In regions of strong mesoscale variability (e.g. Gulf of Mexico), targeted high spatial resolution measurements are required…
Validating Ocean Initial Condition • Validate the temperature (T), salinity (S), and current (U,V) fields at the beginning of the coupled hurricane model forecast • For the subsequent impact on hurricane intensity, the key parameters to validate are: • Sea surface temperature (SST) • Depth of the upper oceanic mixed layer (OML) • Vertical temperature (& salinity?) gradient (i.e. slope) in the upper thermocline directly below the OML
Typical of Gulf of Mexico Common Waters in September Typical of Caribbean Waters in September … but temperature is just one component of the density field … salinity may also be important
2.4 m s-1 4.8 m s-1 Yablonsky and Ginis (2009, MWR, final review)
Mesoscale Oceanic Features in the GoM Rita Katrina Subsurface (75-m) ocean temperature during Katrina & Rita Warm Loop Current water and a warm core ring extend far into the Gulf of Mexico from the Caribbean… MS AL GA TX LA FL warm core ring Loop Current Gulf of Mexico Caribbean Mexico °C
Representing Mesoscale Features • In Atlantic Basin, main mesoscale oceanic features are the Gulf Stream (SE US coast) and the Loop Current and associated warm- and cold-core rings (Gulf of Mexico) • During hurricane season, the Gulf Stream position can generally be observed from SST data, but… • Loop Current and rings are typically indiscernible from SST • For the Gulf of Mexico, sea surface height based on satellite altimetry is key for determining and validating the shape and location of the Loop Current and rings
Validating Mesoscale Features in Ocean Model in GoM • More available satellites… more accurate validation? 1 2 4 3 Courtesy of G. Goni
Validating Mesoscale Features in Ocean Model in GoM • Targeted in situ data deployment (e.g. AXBTs) may be used to supplement altimetry and to validate the model-initialized subsurface (upper thermocline) horizontal temperature gradient across the Loop Current and rings Altimetry 15 Sept. 2005 Numbers 1-18 indicate AXBT locations Rita’s future track
Data-assimilated GDEM Can use in situ data (e.g. AXBTs) to define temperature profiles in center of LC, WCRs, and CCRs Altimetry Feature-based assimilation in GFDL/POM & HWRF/POM initialization Yablonsky and Ginis (2008, MWR) Finally, assimilate SST and integrate ocean model 48 hrs for geostrophic adjustment We will support the HWRF/POM at the DTC Hyun-Sook will discuss HYCOM’s continuous data assimilation procedure, which is different
Impact of improved initialization of the Loop Current (LC) on a GFDL model intensity forecast Central Pressure Hurricane Katrina Forecast: Initial time: Aug. 26, 18Z Observed LC 24oN (climatological position) LC 27.5oN (actual position)
Where do we want measurements? Subsurface (75-m) ocean temperature AXBTs dropped along these 3 flight legs would help validate LC, WCR, and CCR structure, frontal location, and magnitude prior to storm passage Rita Katrina MS AL GA TX LA X FL X X X X X X X X WCR X X X X X X X X X X X X X X LC X Gulf of Mexico Caribbean Mexico °C
Storm-core SST reduction (revisited) • SST can decrease in the hurricane’s core by: • Vertical mixing/entrainment • Upwelling • Horizontal advection of a surface cold pool • Heat flux to the atmosphere Earlier… Earlier… Small by comparison
Warm Core Ring: Not just high heat content • Has anticyclonic circulation & is a thermocline feature • Since warm water is deep in the ring, WCRs generally • restrict hurricane-induced SST cooling, BUT… • Can a WCR’s circulation increase storm-core SST • cooling via advection? • If so, only a 3-D ocean model (not 1-D) should be able • to capture this result… Yablonsky and Ginis (2009, MWR, in review)
A T M O S P H E R E Prescribed translation speed Cyclonic hurricane vortex < < < < < < < < O C E A N Homogeneous initial SST Vary position of ring relative to storm track < < < < Horizontally-homogeneous subsurface temperature Warm core ring evident in subsurface temperature field WCRC WCRR WCRL CTRL
SST & current vectors… storm is ~50 km past center of WCR… 3-D experiments WCRC CTRL > WCR Storm Storm < Speed = 2.4 m s-1 > WCRL WCRR WCR < > Storm Storm WCR <
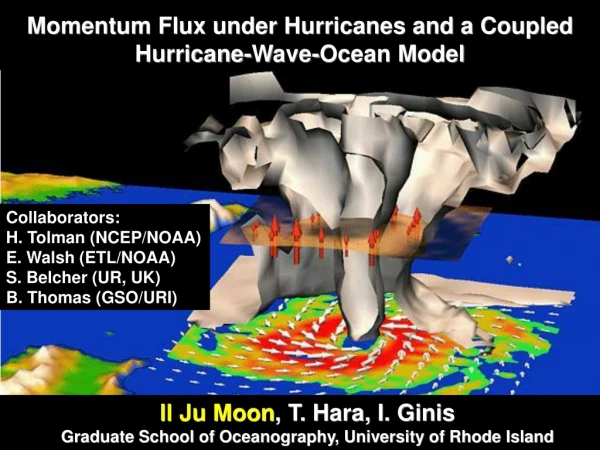
Conventional Coupling Between Hurricane and Ocean Models Hurricane Model Momentum flux (τ) Sensible heat flux (QH) Latent heat flux (QE) Surface current (Us) SST (Ts) Wind speed (Ua) Temperature (Ta) Humidity (qa) Momentum flux (τ) • Assumption • Atmosphere is in equilibrium • with sea state • Waves are fully-developed Air-Sea Interface Ocean Model
Coupled Hurricane-Wave-Ocean Frameworkfor Future HWRF and GFDN Models With wave and spray coupling, measurements near the air-sea interface are critical for validating heat and momentum fluxes
Wave Model Validation Hurricane Ivan (2005) Buoy measurements Satellite measurements SRA measurements Fan, Ginis, Hara & Walsh (2009)
Wave Model Validation: Hurricane Ivan Wave Direction Experiment A: WAVEWATCH III wave model (operational model) Experiment B: Coupled wind-wave model (accounts for sea state) Experiment C: Coupled wind-wave-current model SRA SRA data number Dominant Wave Length Significant Wave Height Sept. 09: Using SRA Measurements For Validation SRA data number SRA data number
Other instrumentation? • D’Asaro et al. (2007, GRL): Surface drifters, profiling SOLO floats, profiling EM-APEX floats, & Lagrangian floats deployed during Hurricane Frances (2003) • Jarosz et al. (2007, Science): Current and wave/tide gauge moorings used to estimate air-sea momentum flux on the GoM continental shelf during the passage of Hurricane Ivan (2004) just prior to landfall • Communication between modelers and those who make relevant observations is essential
Data-assimilated GDEM Or… define using real data: e.g. AXBT 6 for LC and AXBT 13 (14) for WCR (CCR) x x x x x x x x x x x x x x x Altimetry How we modify GDEM T/S Climatology:Feature-based modeling! • Start with • Sept. GDEM • Look at • altimetry/axbts • Define LC & • ring positions • Use Caribbean • water along • LC axis & in • warm core • ring center Finally, assimilate SST and integrate ocean model for 48 hrs for geostrophic adjustment • Make cold core • ring center • colder than env. • Blend features • w/ env. & • sharpen fronts
3) Horizontal advection of surface cold pool A T M O S P H E R E Preexisting cold pool is located outside storm core Preexisting current direction is towards storm core Cyclonic hurricane vortex Cold pool is advected under storm core by currents O C E A N Warm sea surface temperature Cool subsurface temperature This is a horizontal process
SST cooling within 60-km radius of storm center 3-D 1-D WCRC WCRC Increased Cooling WCRR WCRL CTRL CTRL WCRR Mean ΔSST Mean ΔSST Speed = 2.4 m s-1 > > 3-D WCR 1-D WCR < < Storm Storm WCRR SST – CTRL SST WCRR SST – CTRL SST
SST cooling within 60-km radius of storm center 3-D 1-D Increased Cooling WCRR CTRL CTRL Mean ΔSST Mean ΔSST WCRR Speed = 4.8 m s-1 > > 3-D WCR 1-D WCR < < Storm Storm WCRR SST – CTRL SST WCRR SST – CTRL SST
Summary • It is well-established that WCRs may impart a non-negligible influence on hurricane intensity by altering storm-core SST cooling • BUT it is misleading to treat WCRs as simply regions of increased heat content without regard for: • translation speed of the storm • location of the ring relative to the storm track • 3-D models are necessary to capture upwelling and horizontal advection of a surface cold pool
Coupled Model Results: 2.5 m/s environmental wind & 3-D ocean model component 60-km SST cooling Increased Cooling Legend CTRL WCRC WCRL WCRR 96-h 108-h 84-h Track Central Pressure WCRR Increased Intensity 108-h 96-h WCRC 84-h 84-h 96-h 108-h WCRL
Coupled Model Results: 2.5 m/s environmental wind & 1-D ocean model component 60-km SST cooling Increased Cooling Legend CTRL WCRC WCRL WCRR 96-h 108-h 84-h Track Central Pressure WCRR Increased Intensity 108-h 96-h WCRC 84-h 84-h 96-h 108-h WCRL