Download
1 / 21
210 likes | 216 Views
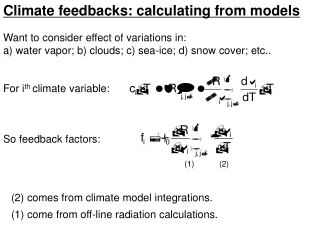
Pitfalls in calculating charge response parameter from etch pit. Rupamoy Bhattacharyya Research Fellow Centre for Astroparticle Physics & Space Science, Bose Institute, Kolkata. Outline of talk. Motivation. Formation of etch pit inside Nuclear Track Detector.

E N D
Pitfalls in calculating charge response parameter from etch pit Rupamoy Bhattacharyya Research Fellow Centre for Astroparticle Physics & Space Science, Bose Institute, Kolkata
Outline of talk • Motivation. • Formation of etch pit inside Nuclear Track Detector. • Estimation of the region of applicability of two widely used methods of calculating charge response parameter. • Experimental confirmation. • Conclusion.
Motivation Nuclear Track Detectors (NTDs) are used to detect particles (size ~ nucleus) by observing their tracks inside detector material. Currently two major experiments use NTDs as their detecting tool Magnetic Monopole search (MoEDAL experiment) at LHCb, CERN Strangelet search at mountain altitude at Bose Institute In these two experiments, people use two different methods to calculate charge response parameter. Our aim is to study the region of applicability of these two methods. Technical Design Report of the MoEDAL experiment CERN-LHC-2009-006, MoEDAL-TDR-1.1, September 21,2009 Strangelet Search at Mountain Altitude by R Bhattacharyya, S Dey, Sanjay K Ghosh, A Maulik, SibajiRaha and D Syam. Proc Indian NatnSciAcad81 No. 1 February 2015 Special Issue, pp. 165-168.
Formation of etch pit inside Nuclear Track Detector (NTD) NTDs belong to a class of passive detectors. Solid State Nuclear Track Detectors are dielectric solids. Organic polymer : Polyethylene Terephthalate (PET) CR-39 Makrofol Electronic energy loss of charged particles follows Bethe-Bloch formula Ionizing particle produces ‘permanent’ damage trail along its direction of motion. Latent Track (diameter 3-10 nm)
Etching : to make “latent track” visible under Optical Microscope • Damaged region contains more chemically active zones than surrounding undamaged portion. • Applying some chemical reagent ( here we use 6.25 N aqueous solution of NaOH ) makes the damaged portion etched out at a faster rate VT (Track etch rate) than the undamaged portion VB(Bulk etch rate) and after that size of the damaged portion increased to ~ µm. • Charge response parameter :: (VT/VB) :: Necessary condition for the formation of etch-pit : VT/VB > 1 • Now if the Detector (transparent) is kept under the microscope we can observe the etch pits. Calibration of a solid state nuclear track detector (SSNTD) with high detectionthreshold to search for rare events in cosmic rays by S. Dey, D. Gupta, A. Maulik, SibajiRaha, Swapan K. Saha, D. Syam, J. Pakarinen, D. Voulot, F. Wenander. Astroparticle Physics 34, 805-808 (2011).
Images of etch pit 85.19 µm 113.29µm Leica DM 4000 optical microscope Screenshot during observation using QWin software under x100 dry objective
Geometry of etch pit -dE/dx Energy Original surface Etched surface
Simulation of etch pit J.F. Ziegler, J.P. Biersack, The Stopping and Range of Ions in Matter (SRIM Computer Code), Version: 2008.04
Formulae for calculating VT/VB From diameter measurement From depth measurement µ Where, S. Balestra et al. / Nucl. Instr. and Meth. in Phys. Res. B 254 (2007) 254–258
Ions on PET R. Bhattacharyya, S. Dey, Sanjay K. Ghosh, A. Maulik, Sibaji Raha, D. Syam . Nuclear Instruments and Methods in Physics Research B 370 (2016) 63–66
Experiment at IUAC General Purpose Scattering Chamber (GPSC) at IUAC PET films (5 cm × 5 cm) inside aluminium holders
Beam details 132 MeV 70.4 MeV 76.9 MeV
Updated table of PET E vs. dE/dx plot for PET
Calibration curve of PET Y=0.31+0.18 X- 7.7 E-4 X2 Using depth measurement method Using diameter measurement method
Results from CR-39 and Makrofol detectors Base area distribution of etched cones in CR39 from 158 A GeV In49+ ions and their fragments Base area distribution of etched cones in Makrofol from158 A GeV Pb82+ ions and their fragment p versus REL for Makrofol p versus REL for CR39 S. Balestra et al. Nucl. Instr. and Meth. in Phys. Res. B 254 (2007) 254–258
Conclusion • Although by diameter measurement, one can easily get the value of 'p' at the surface we found that this formula can't be used blindly. • For dE/dx > 23 [MeV/(mg/cm2)] we observe that b>VB×t (so E >1); So in this region conical approximation of etch pits doesn’t hold good. Moreover near E~1 this formula started giving absurd results and value of ‘p’ diverges. • Above p~4 from diameter measurement method or above p~5 from depth measurement method, depth measurement method provides more reliable results.
Acknowledgement Group members: SandhyaDey, Sanjay K. Ghosh,AtanuMaulik,SibajiRaha, DebapriyoSyam Funding agency : IRHPA (Intensification of Research in High Priority Areas) Project of the (SERC), DST, Government of India, New Delhi.