Download
1 / 22
220 likes | 311 Views
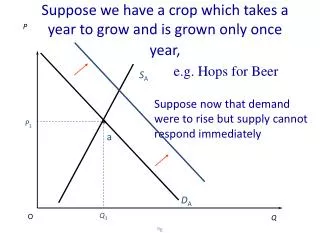
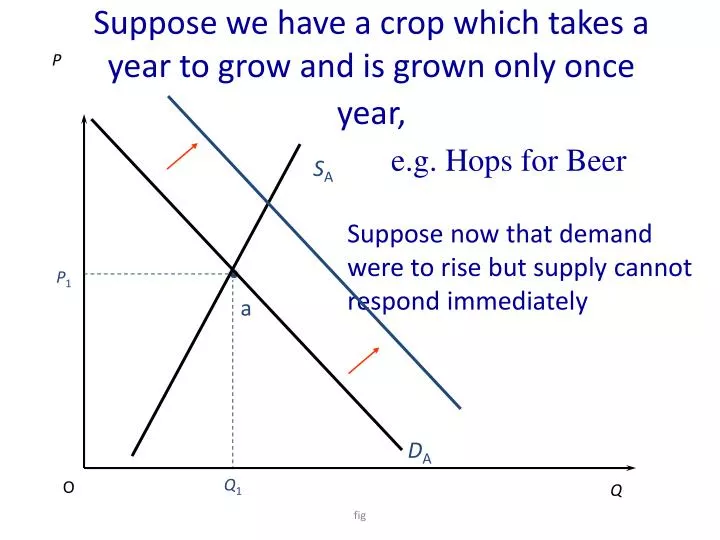
Suppose we have a crop which takes a year to grow and is grown only once year,. P. e.g. Hops for Beer. S A. Suppose now that demand were to rise but supply cannot respond immediately. P 1. a. D A. Q 1. O. Q.

E N D
Suppose we have a crop which takes a year to grow and is grown only once year, P e.g. Hops for Beer SA Suppose now that demand were to rise but supply cannot respond immediately P1 a DA Q1 O Q fig
Suppose we have a crop which takes a year to grow and is grown only once year, P e.g. Hops for Beer SA Suppose now that demand were to rise but supply cannot respond immediately P1 a What will happen to Price? DA Q1 O Q fig
Since supply is fixed, the price is determined by the available supply at Q1. P SA P2 So price rises to P2 P1 a DB DA Q1 O Q fig
But next period farmers observe that the price of hops was very high • So now they all want to grow hops • At P2, what will the supply be?
P SA At P2, the following year supply increases to Q3 P2 P1 a DB DA Q1 O Q3 Q fig
P SA But now Supply exceeds demand so price must fall to P3 P2 P3 P1 a DB DA Q1 O Q3 Q fig
P SA But next period farmers see lower price and decide to supply less: Q4 P2 P3 P1 a DB DA Q1 O Q4 Q3 Q fig
P SA Notice here that we are spiraling through time to an equilibrium P2 P3 This is a stable Cobweb P1 a DB DA Q1 O Q4 Q3 Q fig
Suppose instead that the supply curve was very flat. P SA Now what will happen to Price? P1 a DA Q1 O Q fig
Suppose instead that the supply curve was very flat. P SA Now what will happen to Price? P1 a DA Q1 O Q fig
Since supply is fixed, again the price must rise to P2 P SA P1 a DB DA Q1 O Q fig
Since supply is still fixed at Q1, again the price must rise to P2 P SA P2 But next period farmers observe that the price of hops was very high So now they all want to grow hops P1 a DB DA Q1 O Q fig
P At P2, what will the supply be in this case? SA P2 P1 a Now Supply Increases to Q5 DB DA Q1 O Q Q5 fig
But again Supply exceeds demand so price must fall to P5 P SA P2 P1 a P5 DB DA Q1 O Q Q5 fig
But at P5 next period farmers decide to supply Q6 P SA P2 P1 a P5 DB DA Q1 O Q Q6 Q5 fig
P6 But if only Q6 is supplied demand will exceed supply and price will rise to P6 SA P2 P1 a P5 DB DA Q1 O Q Q6 Q5 fig
But Now the price and quantity are gradually spiraling away from equilibrium. This is an unstable cobweb. P6 SA P2 P1 a P5 DB DA Q1 O Q Q6 Q5 fig
Summary of Cobweb Effects • With a demand SHIFT and supply fixed yearly, a sudden rise in demand will see a big increase in income. • The lagged response next year can generate cyclical fluctuations in prices over the next few years. • When Q goes up and P fall, income PxQ can also fluctuate. • Not all cobwebs are stable
Supply Side Shock P SRSA SRSE LRS is the long-run supply curve. SRSE is the expected supply this year. LRS PA e PE SRSA is the actual supply this year. e.g. Bad harvest D QA QE O Q fig
Supply Side Shock P SRSA SRSE So price rises, what about income? PEeQEO=ab is expected income LRS PA c e PE ac= actual income Overall depends on size of c relative to b a b D QA QE O Q fig
Supply Side Shock P SRSA SRSE PA If demand is more inelastic, c>b and income rises. LRS c e PE ac= actual income Overall depends on size of c relative to b a b D QA QE O Q fig
Supply Side Shock P SRSE SRSA But if it is a good crop and demand is inelastic, LRS c < b and income falls So variability in incomes leads to pressure for government intervention e PE b PA a c D QE O QA Q fig