Download
1 / 21
210 likes | 345 Views
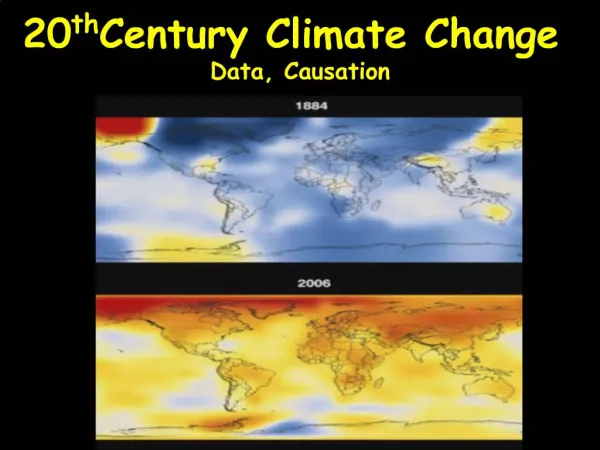
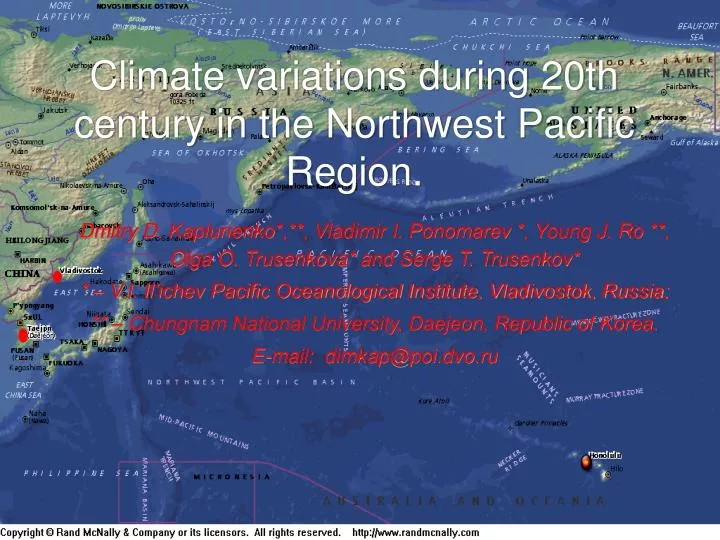
Climate variations during 20th century in the Northwest Pacific Region. Dmitry D. Kaplunenko * , ** , Vladimir I. Ponomarev * , Young J. Ro ** , Olga O. Trusenkova * and Serge T. Trusenkov * * – V.I. Il’ichev Pacific Oceanological Institute, Vladivostok, Russia;

E N D
Climate variations during 20th century in the Northwest Pacific Region. Dmitry D. Kaplunenko*,**, Vladimir I. Ponomarev *, Young J. Ro **, Olga O. Trusenkova* and Serge T. Trusenkov* * – V.I. Il’ichev Pacific Oceanological Institute, Vladivostok, Russia; ** – Chungnam National University, Daejeon, Republic of Korea. E-mail: dimkap@poi.dvo.ru
Introduction This work provides: • Study of climate variability by the datasets based on different methods of data augmentation (instrumental and reanalysis based) - Analysis on climate variability by the data on monthly air temperature for Northeast Asia and SST for North Pacific region for centennial (correlations, wavelets) and semicentennial period (correlations, wavelets, trends)
Used data sources • Instrumental: Air Temperature: Global History Climatic Network: http://lwf.ncdc.noaa.gov/oa/pub/data/ghcn/v2/ghcnftp.htmlSST: GLBSST (Japan Meteorological Agency) ftp://ddb.kishou.go.jp/pub/Climate/SeaSurfaceTemp • Reanalysis based: Air Temperature: NCEP/NCAR Reanalysis project data: http://www.cdc.noaa.gov/cdc/data.ncep.reanalysis.html SST: Hadley Centre for Climate Prediction and Research: http://badc.nerc.ac.uk/data/hadisst/
Data coverage (Tair) Data coverage for meteorological data: Contribution (GHCN stns.): NCEP: 2.5°x2.5°
Data coverage (SST) Sea surface temperature. • GLBSST (Japan Meteorological Agency) (North Pacific, period 1946-2002, 2°x2°) • Hadley Centre for Climate Prediction and Research (North Pacific,1946-2002,1870-2002,1°x1° ) Data coverage:
Assessing of climate changes by prepared datasets using known statistical methods Assessing methods: • Principal Component Analysis (EOF,CEOF) • Correlation and spectral analysis (wavelet) • Linear trend estimation Object of interest: • Northeast Asia • North Pacific Data for assessing: • Sea Surface Temperature, Air temperature mean values for 1946-2002 (GHCN, NCEP/NCAR, JMA GLBSST, Hedley SST) and 1870-2002 (Hedley SST)
EOF-decomposition instrumental data Air temperature SST
CEOF-decomposition instrumental data Air temperature SST
EOF-decomposition reanalysis data Air temperature SST NCEP
CEOF-decomposition reanalysis data Air temperature SST
Wavelet derived oscillations for instr. data (Tair) Scale-averaged wavelet power over the 3–7-yr, 8-20-yr and 21-50-yr band for the GHCN dataset for winter
Wavelet derived oscillations for instr. data (SST) Scale-averaged wavelet power over the 3–7-yr, 8-20-yr and 21-50-yr band for the JMA dataset for winter
Wavelet derived oscillations for reanal. Data (Tair) Scale-averaged wavelet power over the 3–7-yr, 8-20-yr and 21-50-yr band for the NCEP dataset for winter
Wavelet derived oscillations for reanal. data (SST57) Scale-averaged wavelet power over the 3–7-yr, 8-20-yr and 21-50-yr band for the Hedley (56 years) dataset for winter
Wavelet derived oscillations for reanal. Data (SST133) Scale-averaged wavelet power over the 3–7-yr, 8-20-yr and 21-50-yr band for the Hedley (132 years) dataset for winter
PDO-correlations with instr. data temporal modes and PDO for GHCN data on period 1946-2002. modes and PDO for GLBSST (JMA) data on period 1946-2002
PDO-correlations with reanal. data temporal modes and PDO for NCEP data on period 1948-2002 temporal modes and PDO for HEDLEY data on period 1946-2002
PDO-correlations with reanal. Data (Hedley SST 1900-2002) Correlation analysis on temporal modes and PDO for Hedley SST data on period 1900-2002.
Linear trends estimation results Instrumental Data: Reanalysis Data
Conclusions • Both types of used dataset (instrumental and reanalysis) is could be used for study climatic variability at the decadal and multidecadal scales and shows its relations to the climatic processes at ocean-atmosphere system observed by the other data. • Scale averaged oscillations show the similar tendencies for the spectral analysis for correspondent data sets (air temperature/SST). • The correlation analysis on the propagating signals influence for these dataset is rather complicated, but SST is highly correlated with the PDO in all cases • Long-term tendencies analysis shows better agreement for instrumental data observations (more real) than for reanalysisdata