Download
1 / 31
310 likes | 445 Views
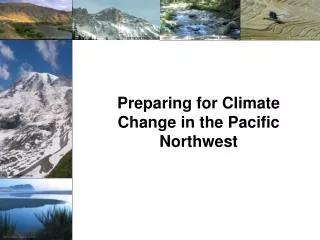
Climate Change in the Pacific Northwest (PNW). By Edward L. Miles Team Leader JISAO/SMA Climate Impacts Group (CIG) Center for Science in the Earth System (CSES) University of Washington. Acknowledgements. Alan Hamlet - Civil & Environmental Eng., CIG

E N D
Climate Change in the Pacific Northwest (PNW) By Edward L. Miles Team Leader JISAO/SMA Climate Impacts Group (CIG) Center for Science in the Earth System (CSES) University of Washington
Acknowledgements • Alan Hamlet - Civil & Environmental Eng., CIG • Dennis Lettenmaier - Civil & Environmental Eng., CIG • Nathan Mantua - CIG, Asst. Dir. CSES • Philip Mote - CIG, State Climatologist • Amy Snover - CIG
Background: The UW Climate Impacts Group (CIG) • Created July 1, 1995 • Sponsored jointly by JISAO/SMA • Funded by NOAA/OGP -- first of RISA program -- and the University of Washington
Columbia River Basin The Climate Impacts Group Areas of study: Water resources Salmon Forests Coasts Motivation: • Increase regional resilience to climate variability and change • Produce science useful to the decision making community An understanding of the patterns and consequences of past climate variability, policy responses and their impacts is essential for preparing for future changes in climate.
The Pacific Decadal Oscillation El Niño/Southern Oscillation A history of the PDO A history of ENSO Monthly values for ENSO3.4 index: 1900-1998 warm warm cool warm cool 1900 1910 1920 1930 1940 1950 1960 1970 1980 1990 2000 Two Important Patterns of PNW Climate Variability Monthly values for the PDO index: January 1900-December 2003
Representation of the PNW Climate System The human dimension is embedded in each sector
Are we prepared for a changing climate? Natural resource management presently assumes that climate does not change… …but what if it does?
20th Century Trends • Global temperature warming ~ 0.6C (1.1F) over last century • PNW climate changing over last century: • Temperature increasing ~ 0.8C (1.5F) • Precipitation increasing 10-30% • Snowpack declining, esp. at elevations <6000ft. • Glaciers shrinking
Decisions are frequently based on assumptions about the future… Planning and policy assumptions: PNW Population • Population growth • Economic forecasts • Land use change • Water demand • Energy demand
Trends in April 1 snow water equivalent, 1950-2000 increase decrease Source: Mote, P. W. 2003. Trends in snow water equivalent in the Pacific Northwest and their climatic causes. Geophysical Research Letters 30(12) 1601, doi:10.1029/2003GL017258, 2003. Declines in PNW Snowpack, 1950-2000 Most stations showing a decline in April 1 snowpack throughout the PNW
Temperature trends (°C per century), since 1920 Trends in 20th Century PNW Temperature increase decrease Almost every station – urban and rural – shows warming PNW climate is already changing, possiblydue (in part) to climate change Source: Mote, P. W. 2003. Trends in temperature and precipitation in the Pacific Northwest during the twentieth century. Northwest Science 77(4): 271-282.
Snowpack, Elevation, and Temperature Snowpack at mid to low elevations most sensitive to warming temperatures
Northwest Warming Scenarios For the decades of the 2020s and 2040s Degrees C
~1.5 to 3°C (~ 3 to 6°F) warmer in the 2040s
Projected Changes in PNW April 1 Snowpack • Regional decline - 47% by 2090s • Western WA/OR decline – 72% by 2090s Provided by Dennis Lettenmaier and Andy Wood, UW Civil Engineering Accelerated Climate Prediction Initiative, a UW-SIO-PNNL collaboration
30-50% less water in the summer Natural Columbia River flow at the Dalles, OR Hydrologic Impacts • Less snow, earlier melt means less water in summer. Affects: • irrigation • urban uses • fisheries protection • energy production • More water in winter increases potential for: • more hydropower production • more winter flooding Predicted flow in 2050s Present flow Courtesy of Hamlet and Lettenmaier, UW Civil Engineering
Natural streamflow Managed streamflow The Columbia Basin Hydrosystem • Major source of hydropower in the PNW • Navigation and recreation uses • Major source of irrigation for the interior PNW • Threatened and endangered salmon runs
Percent of total annual flow ? ? Storage of Columbia River Water Reservoir capacity only 30% of current total annual streamflow
Little or no room for growth in supply for the Columbia River and much of the PNW. Patterns of year-to-year and decade-to-decade climate variability may exacerbate or ameliorate potential impacts. Level of water scarcity is relatively new. Demands on water systems are growing, but supplies remain essentially fixed. Less margin of safety available to cope with the unexpected. Regionin severe difficulty even if climate doesn’t change Management system inadequate to task, 2000-2020: Highly fragmented; No one management entity in charge re droughts; Little or no inter-use coordination; Inconsistent standards, re: water quantity and quality across basins; Conflicting management practices: international, federal, states, counties, private, tribal lands; Large number of largely uncoordinated planning efforts; No official incorporation of climate change scenarios in planning. The Problem: The System is Already Taxed Increasing Scarcity and Conflict2000-2020
Conclusions • Climate change presents challenges and opportunities for the PNW • Impacts to water resources represent our most significant vulnerability • System is already operating at the margins • Does the risk of multi-year droughts increase? • More resource managers recognizing the importance of planning for climate change (e.g., Seattle, Portland)… but technical and financial resources limited • Leadership from White House & U.S. Congress needed
Policy Hurdles • Increasing intensity to trade-off conflicts: • East Side trade-offs - Hydro/Fish/Agriculture • West Side trade-offs – Municipal & Industrial/Hydro/Fish • East Side vs. West Side conflict • Heavy emphasis on State sovereignty • Differences Idaho vs. Oregon & Washington • re: application of Prior Appropriation rule.
Policy Hurdles (cont’d) • System is top-down. Technical level cannot determine own planning scenarios. • System currently includes only population growth & ESA applications in long term planning. • Policy level says they unlikely to face up to climate change challenge without leadership from white House & U.S. Congress (i.e., system is top-down for them too).
Four Broad Policy Objectives • Need to: • Consider the probability & direction of regional climate change (more rain, less snow, increased summer droughts in face of higher demand) as a problem in risk management. • Direct U.S. Army Corps of Engineers to consider scenarios of regional climate change in its long-range plans as the Corps revises its operations manual for the Columbia River. • Support development and maintenance of a comprehensive regional climate monitoring system. • Push for a regional/federal discussion re policy dimensions of climate change & water resources.
Water Resource Impacts: A Major Policy Lever for Change • Widespread official recognition of the lack of capacity of regional water resources system to meet present and anticipated future demands even without climate change! Washington State Governor Gary Locke, 19 November 2002: “Will global climate changes make water shortages a regular fact of life for our state? There is evidence…that our state’s climate is changing. What if the summer becomes the norm for us, over time? Can we adequately prepare for such a fundamental change in our state?”
West Coast Governors’ Initiative on Climate Change • Research on the impacts of climate change lead to first-ever joint Washington-Oregon-California mitigation initiative in 2003 • Oregon science/policy climate change advisory committee established January 2004 as part of initiative Washington State Governor Gary Locke, 1 October 2003: “Climate change is one of the most serious environmental issues facing our planet today… I believe that it is important for us as a state and region to reduce our contribution to the emission of global warming gases. Last week, Governors Davis, Kulongoski and I committed our states to work jointly to reduce global warming gases…”
1997: • First regional-scale examination of climate change impacts on PNW • Most stakeholders unfamiliar with potential impacts of climate change & unprepared to use this type of information • Spatial scale of interest << scale of analysis 1995: Few managers • Saw a role for climate information in planning & decision making • Recognized predictability of climate (variability or change) • Possessed a contextual framework for applying climate change information 1997-2001: • Increasingly focused climate change research • Intensive region-wide outreach • Shift in attitudes: widespread official recognition of regional water resources systems’ lack of capacity to meet present & anticipated future demands even without climate change! • Out in front: Portland & Seattle Planning for Climate Change
Stakeholders requested: • Climate change information for use in existing planning models • Case studies of incorporating climate change projections into basin planning 2001 high level water policy workshop: • Climate change = potentially significant threat to regional water resources • Climate change information = critical to future planning • Significant step forward! Requirements of climate change information: • more detailed, small scale information (catchment, watershed) • must be “easy to apply to the problem at hand” Planning for Climate Change (cont’d)
Impacts of Climate Change on the PNW Impact Negative(-) Positive (+) • Highest confidence • Models: warmer; higher snow line • summer water supply, drought • increased demand for water • conflicts over water resources • winter streamflow increases in snowmelt-driven basins • salmon freshwater survival • reduced energy demand for winter heating, increased demand for summer air conditioning energy production
Impacts of climate change on the PNW (cont’d) Impact Negative(-) Positive (+) • Medium confidence, greater uncertainty • Models: higher winter precipitation • increased winter runoff • forest growth and seedling establishment • forest disturbance flooding at high elevations at low elevations fires, pests
Impact Negative(-) Positive (+) Impacts of climate change on the PNW (cont’d) • Large uncertainty: • Total and summer precipitation, changes in variability, coastal winds and currents • annual streamflow changes • forest area • salmon ocean survival • coastal ecosystems, poleward range extensions • human health (diseases, air quality)