Download
1 / 57
640 likes | 910 Views
CHAPTER 3. Systems Development and Documentation Techniques. INTRODUCTION. Questions to be addressed in this chapter include: What is the purpose of documentation? Why do accountants need to understand documentation? What documentation techniques are used in accounting systems?

E N D
CHAPTER 3 Systems Development and Documentation Techniques
INTRODUCTION • Questions to be addressed in this chapter include: • What is the purpose of documentation? • Why do accountants need to understand documentation? • What documentation techniques are used in accounting systems? • What are data flow diagrams and flowcharts? • How are they alike and different? • How are they prepared?
INTRODUCTION • Documentation includes the following types of tools: • Narratives (written descriptions) • Flowcharts (document, system, program) • Diagrams (DFD) • Other written material
INTRODUCTION • Documentation covers the who, what, when, where, why, and how of: • Data entry • Processing • Storage • Information output • System controls
INTRODUCTION • How do accountants use documentation? • At a minimum, they have to read documentation to understand how a system works. • They may need to evaluate the strengths and weaknesses of an entity’s internal controls. • Requires heavy reliance on documentation • They may examine documentation to determine if a proposed system meets the needs of its users. • They may prepare documentation to: • Demonstrate how a proposed system would work • Demonstrate their understanding of a system of internal controls
INTRODUCTION • In this chapter, we discuss two of the most common documentation tools: • Data flow diagrams • Graphical descriptions of the sources and destinations of data. They show: • Where data comes from • How it flows • The processes performed on it • Where it goes
INTRODUCTION • In this chapter, we discuss two of the most common documentation tools: • Data flow diagrams • Flowcharts • Include three types: • Document flowcharts describe the flow of documents and information between departments or units. • System flowcharts describe the relationship between inputs, processing, and outputs for a system. • Program flowcharts describe the sequence of logical operations performed in a computer program.
INTRODUCTION • Documentation techniques are necessary tools for accountants: • SAS-94 requires that auditors understand the automated and manual procedures an entity uses. • This understanding can be gleaned through documenting the internal control system—a process that effectively exposes strengths and weaknesses of the system. • SOX (2002) effectively requires that publicly-traded corporations and their auditors document and test the company’s internal controls. • Auditing Standard No. 2 promulgated by the PCAOB requires that the external auditor express an opinion on the client’s system of internal controls.
INTRODUCTION • Documentation tools help accountants by: • Organizing very complicated systems into a form that can be more readily understood. • Helping new team members understand a pre-existing system.
INTRODUCTION • Which method should you use—flowcharts or DFDs? • Both are used by IS professionals. • Both can be prepared relatively simply using available software. • Both are tested on professional exams. • CONCLUSION: You need to know them both
DATA FLOW DIAGRAMS (DFDs) • A data flow diagram (DFD) graphically describes the flow of data within an organization. It is used to: • Document existing systems • Plan and design new systems • There is no black-and-white approach to developing a DFD. Pg. 69 of the AIS text gives 15 guidelines for making a DFD.
DATA FLOW DIAGRAMS • A data flow diagram consists of four basic elements: • Data sources and destinations • Data flows • Transformation processes • Data stores
Accounts Receivable DATA FLOW DIAGRAMS • Example of a data flow diagram of the customer payment process from Figure 3-3 in your AIS textbook. 1.0 Process Payment 2.0 Update A/R Customer payment Customer Receivables Information Remittance data Credit Manager Deposit Bank
DATA FLOW DIAGRAMS • Subdividing the DFD: • Few systems can be fully diagrammed on one sheet of paper, and users have needs for differing levels of detail. • Consequently, DFDs are subdivided into successively lower levels to provide increasing amounts of detail.
DATA FLOW DIAGRAMS • The highest level of DFD is called a context diagram. • It provides a summary-level view of the system. • It depicts a data processing system and the external entities that are: • Sources of its input • Destinations of its output
DATA FLOW DIAGRAMS Govt. Agencies Depart- ments Tax report & payment Time cards Payroll Processing System Employees Employee checks Payroll check New employee form Bank Employee change form Human Resources Payroll report • This is the context diagram for the S&S payroll processing system (Figure 3-5 in your textbook). Manage- ment
DATA FLOW DIAGRAMS (15 rules) • RULE 1: Understand the system. Observe the flow of information and interview people involved to gain that understanding. • RULE 2: Ignore control processes and control actions (e.g., error corrections). Only very critical error paths should be included. • RULE 3: Determine the system boundaries—where it starts and stops. If you’re not sure about a process, include it for the time being.
DATA FLOW DIAGRAMS • RULE 4: Draw the context diagram first, and then draw successively greater levels of detail. • RULE 5: Identify and label all data flows. The only ones that do not have to be labeled are those that go into or come out of data stores. • RULE 6: Data flows that always flow together should be grouped together. Those that do not flow together should be shown on separate lines.
DATA FLOW DIAGRAMS • RULE 7: Show a process (circle) wherever a data flow is converted from one form to another. Likewise, every process should have at least one incoming data flow and at least one outgoing data flow. • RULE 8: Transformation processes that are logically related or occur simultaneously can be grouped in one bubble. • RULE 9: Number each process sequentially. A process labeled 5.0 would be exploded at the next level into processes numbered 5.1, 5.2, etc. A process labeled 5.2 would be exploded into 5.21, 5.22, etc.
DATA FLOW DIAGRAMS • RULE 10: Process names should include action verbs, such as update, prepare, etc. • RULE 11: Identify and label all data stores, whether temporary or permanent. • RULE 12: Identify and label all sources and destinations. An entity can be both a source and destination. You may wish to include such items twice on the diagram, if needed, to avoid excessive or crossing lines.
DATA FLOW DIAGRAMS • RULE 13: As much as possible, organize the flow from top to bottom and left to right. • RULE 14: You’re not likely to get it beautiful the first time, so plan to go through several iterations of refinements. • RULE 15: On the final copy, lines should not cross. On each page, include: • The name of the DFD • The date prepared • The preparer’s name
DATA FLOW DIAGRAMS • The DFD focuses on the logical flow of data. • Next, we will discuss flowcharts, which place greater emphasis on physical details.
FLOWCHARTS • A flowchart is an analytical technique that describes some aspect of an information system in a clear, concise, and logical manner. • Flowcharts use a set of standard symbols to depict processing procedures and the flow of data. • Flowcharting History: • Introduced in 1950s by industrial engineers to document business processes and document flows for process improvement. • Sarbanes-Oxley 2002 increased importance by requiring companies to document business processes and internal controls procedures.
FLOWCHARTS • Every symbol on a flowchart depicts a unique operation, input, processing activity, or storage medium. • Years ago, flowcharts were manually created using plastic templates. (I had a set of these) • Most flowcharts are now drawn using a software program such as Visio. • Microsoft and Power Point are also used. • The software uses pre-drawn shapes, and the developer drags the shapes into the drawing.
FLOWCHARTS • There are four types (groups) of flowcharting symbols: • Input/output symbols • Processing symbols • Storage symbols • Flow and miscellaneous symbols
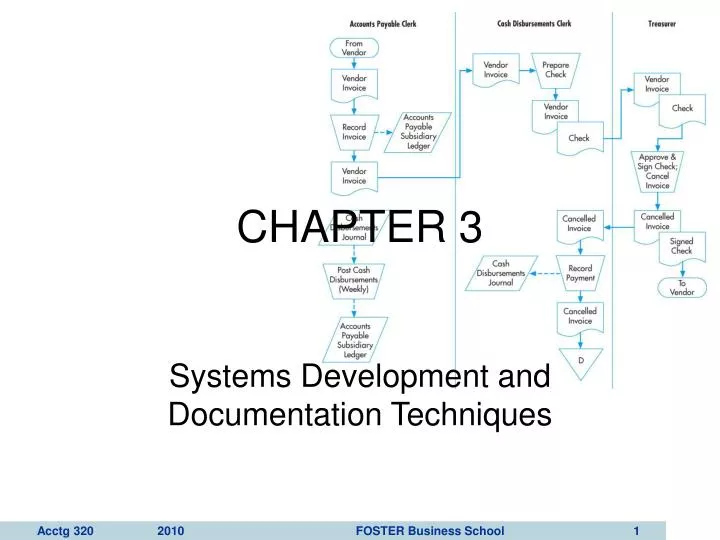
DOCUMENT FLOWCHARTS • A document flowchart shows the flow of documents and information among areas of responsibility in an organization. • These flowcharts trace a document from cradle to grave and show: • Where a document comes from • Where it’s distributed • How it’s used • It’s ultimate disposition • Everything that happens as it flows through the system
DOCUMENT FLOWCHARTS • Internal control flowcharts are document flowcharts used to evaluate the adequacy of internal controls, such as segregation of duties or internal checks. • They can reveal weaknesses or inefficiencies such as: • Inadequate communication flows • Unnecessarily complex document flows • Procedures that cause wasteful delays • Document flowcharts are also prepared in the system design process.
This is part of the document flowchart from Figure 3-9 in your textbook.
GUIDELINES FOR PREPARING FLOWCHARTS • 3-2 Focus on page 73 of your AIS text gives 20 rules for preparing flowcharts. Make sure to read them.
Output to storage
Input for next process
Forwarding a document
Filing a document
What happens to the document numbers as the documents move to other locations?
SYSTEM FLOWCHARTS • A system flowchart depicts the relationship among the inputs, processes, and outputs of an AIS. • The system flowchart begins by identifying the inputs to the system. • Each input is followed by a process, i.e., the steps performed on the data. • The process is followed by outputs—the resulting new information. • In other words, it’s the same basic input— process—output pattern that we saw in the document flowchart.
System Flowchart Shown in Figure 3-10 in your textbook • Can you spot the input— process—output pattern?
PROGRAM FLOWCHARTS • Program flowcharts illustrate the sequence of logical operations performed by a computer in executing a program. • They also follow an input—process— output pattern.
The program flowchart from Figure 3-11 in your textbook is shown on the right.
FLOWCHARTS VS. DFDs • Now that we’ve examined both flowcharts and DFDs, it may be useful to discuss the differences again. • DFDs place a heavy emphasis on the logical aspects of a system. • Flowcharts place more emphasis on the physical characteristics of the system. • An example may be useful.
FLOWCHARTS VS. DFDs • EXAMPLE: The registrar’s office of a small college receives paper enrollment forms from students. They sort these records alphabetically and then update the student record file to show the new classes.They also prepare class lists from the same data. The sorted enrollment forms are forwarded to the bursar’s office for billing purposes. Class lists are mailed to faculty members.
Students Enrollment Forms 1.0 Update Student Records Student Records Enrollment Forms 2.0 Prepare Class Lists Bursar Enrollment Forms Class Lists Faculty Here’s a DFD that goes with the story.