Download
1 / 76
760 likes | 772 Views
Explore the core material on graph mining and search in biological databases, covering frequent graph patterns, indexing methods, similarity search, and network analysis. Learn about algorithms, applications, properties, approaches, and challenges in graph mining.

E N D
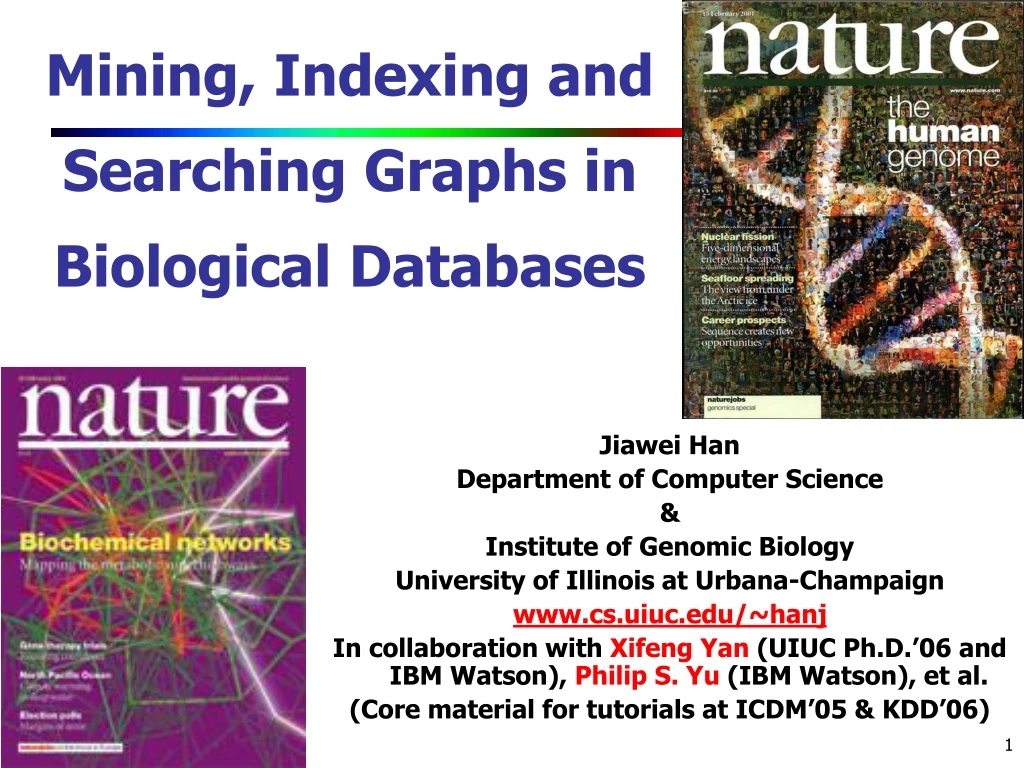
Mining, Indexing and Searching Graphs in Biological Databases Jiawei Han Department of Computer Science & Institute of Genomic Biology University of Illinois at Urbana-Champaign www.cs.uiuc.edu/~hanj In collaboration with Xifeng Yan (UIUC Ph.D.’06 and IBM Watson), Philip S. Yu (IBM Watson), et al. (Core material for tutorials at ICDM’05 & KDD’06)
References: “Covering” Five Papers • X. Yan and J. Han, gSpan: Graph-Based Substructure Pattern Mining, Proc. 2002 Int. Conf. on Data Mining (ICDM'02) (Google Scholar: ranked #3 out of 83,800 entries on “Graph Pattern Mining” on December 20, 2019) • X. Yan and J. Han, CloseGraph: Mining Closed Frequent Graph Patterns, Proc. 2003 ACM SIGKDD Int. Conf. Knowledge Discovery and Data Mining (KDD'03) (Google Scholar: ranked #1 out of 83,800 entries on “Graph Pattern Mining” on December 20, 2019) • X. Yan, P. S. Yu, and J. Han, Graph Indexing: A Frequent Structure-based Approach, Proc. 2004 ACM-SIGMOD Int. Conf. Management of Data (SIGMOD'04) (invited to TODS and published 2005, Google Scholar: ranked #1 out of 39,300 entries on “Graph Indexing” on December 20, 2019) • X. Yan, P. S. Yu, and J. Han, “Substructure Similarity Search in Graph Databases”, Proc. 2005 ACM-SIGMOD Int. Conf. on Management of Data (SIGMOD'05) (invited and published in ACM TODS’06) • H. Hu, X. Yan, H. Yu, J. Han and X. J. Zhou, “Mining Coherent Dense Subgraphs across Massive Biological Networks for Functional Discovery”, Proc. 2005 Int. Conf. Intelligent Systems for Molecular Biology (ISMB'05) (Also in Bioinformatics, 2005)
Graph, Graph, Everywhere from H. Jeong et al Nature 411, 41 (2001) Aspirin Yeast protein interaction network Co-author network An Internet Web
Why Graph Mining and Searching? • Graphs are ubiquitous • Chemical compounds (Cheminformatics) • Protein structures, biological pathways/networks (Bioinformactics) • Program control flow, traffic flow, and workflow analysis • XML databases, Web, and social network analysis • Graph is a general model • Trees, lattices, sequences, and items are degenerated graphs • Diversity of graphs • Directed vs. undirected, labeled vs. unlabeled (edges & vertices), weighted, with angles & geometry (topological vs. 2-D/3-D) • Complexity of algorithms: many problems are of high complexity!
Outline • Mining frequent graph patterns • Graph indexing methods • Similairty search in graph databases • Biological network analysis • Some recent progress on graph mining
Graph Pattern Mining • Frequent subgraphs • A (sub)graph is frequent if its support (occurrence frequency) in a given dataset is no less than a minimum support threshold • Applications of graph pattern mining • Mining biochemical structures • Program control flow analysis • Mining XML structures or Web communities • Building blocks for graph classification, clustering, comparison, and correlation analysis
Example: Frequent Subgraphs Graph Dataset (A) (B) (C) Frequent Patterns (min support is 2) (1) (2)
Frequent Subgraph Mining Approaches • Apriori-based approach • AGM/AcGM: Inokuchi, et al. (PKDD’00) • FSG: Kuramochi and Karypis (ICDM’01) • PATH: Vanetik and Gudes (ICDM’02, ICDM’04) • FFSM: Huan, et al. (ICDM’03) • Pattern growth-based approach • MoFa, Borgelt and Berthold (ICDM’02) • gSpan: Yan and Han (ICDM’02) • Gaston: Nijssen and Kok (KDD’04)
Properties of Graph Mining Algorithms • Search order • breadth vs. depth • Generation of candidate subgraphs • apriori vs. pattern growth • Elimination of duplicate subgraphs • passive vs. active • Support calculation • embedding store or not • Discover order of patterns • path tree graph
Apriori-Based Approach (k+1)-edge k-edge G1 G G2 G’ … G’’ Gn JOIN
Pattern Growth-Based Span and Pruning 1-edge ... 2-edge ... ... If redundant, prune it! ... 3-edge G1 ... ... PRUNED ...
gSpan(Yan and Han ICDM’02) Right-Most Extension Theorem: Completeness The Enumeration of Graphs using Right-most Extension is COMPLETE
e0: (0,1) e1: (1,2) e2: (2,0) e3: (2,3) e4: (3,1) e5: (2,4) DFS Code • Flatten a graph into a sequence using depth first search 0 1 2 4 3
Graph Pattern Explosion Problem • If a graph is frequent, all of its subgraphs are frequent ─ the Apriori property • An n-edge frequent graph may have 2n subgraphs • Among 422 chemical compounds which are confirmed to be active in an AIDS antiviral screen dataset, there are 1,000,000 frequent graph patterns if the minimum support is 5%
Closed Frequent Graphs • Motivation: Handling graph pattern explosion problem • Closed frequent graph • A frequent graph G is closed if there exists no supergraph of G that carries the same support as G • If some of G’s subgraphs have the same support, it is unnecessary to output these subgraphs (nonclosed graphs) • Lossless compression: still ensures that the mining result is complete
CLOSEGRAPH (Yan & Han, KDD’03) A Pattern-Growth Approach (k+1)-edge At what condition, can we stopsearching their children i.e., early termination? G1 k-edge G2 G If G and G’ are frequent, G is a subgraph of G’. If in any part of the graph in the dataset where G occurs, G’ also occurs, then we need not grow G, since none of G’s children will be closed except those of G’. … Gn
Experimental Result • The AIDS antiviral screen compound dataset from NCI/NIH • The dataset contains 43,905 chemical compounds • Among these 43,905 compounds, 423 of them belongs to CA, 1081 are of CM, and the remaining are in class CI
Discovered Patterns 20% 10% 5%
Number of Patterns: Frequent vs. Closed CA Number of patterns minimum support
Runtime: Frequent vs. Closed CA runtime (sec) minimum support
Do the Odds Beat the Curse of Complexity? • Potentially exponential number of frequent patterns • The worst case complexty vs. the expected probability • Ex.: Suppose Walmart has 104 kinds of products • The chance to pick up one product 10-4 • The chance to pick up a particular set of 10 products: 10-40 • What is the chance this particular set of 10 products to be frequent 103 times in 109 transactions? • Have we solved the NP-hard problem of subgraph isomorphism testing? • No. But the real graphs in bio/chemistry is not so bad • A carbon has only 4 bounds and most proteins in a network have distinct labels
Outline • Mining frequent graph patterns • Graph indexing methods • Similairty search in graph databases • Biological network analysis • Some recent progress on graph mining
query graph graph database Graph Search: Querying Graph Databases • Querying graph databases: • Given a graph database and a query graph, find all graphs containing this query graph
(a) (b) (c) Query graph Scalability Issue • Sequential scan • Disk I/O • Subgraph isomorphism testing • An indexing mechanism is needed • DayLight: Daylight.com (commercial) • GraphGrep: Dennis Shasha, et al. PODS'02 • Grace: Srinath Srinivasa, et al. ICDE'03 Sample database
Indexing Strategy Query graph (Q) Graph (G) If graph G contains query graph Q, G should contain any substructure of Q Substructure Remarks • Index substructures of a query graph to prune graphs that do not contain these substructures
Framework • Two steps in processing graph queries Step 1. Index Construction • Enumerate structuresin the graph database, build an inverted index between structures and graphs Step 2. Query Processing • Enumerate structuresin the query graph • Calculate the candidate graphs containing these structures • Prune the false positive answers by performing subgraph isomorphism test
Cost Analysis Query Response Time Disk I/O time Isomorphism testing time Graph index access time Size of candidate answer set Remark: make |Cq| as small as possible
Path-Based Approach Sample database (a) (b) (c) Paths 0-length: C, O, N, S 1-length: C-C, C-O, C-N, C-S, N-N, S-O 2-length: C-C-C, C-O-C, C-N-C, ... 3-length: ... Built an inverted index between paths and graphs
Problems of Path-Based Approach Sample database (a) (b) (c) Query graph Only graph (c) contains this query graph. However, if we only index paths: C, C-C, C-C-C, C-C-C-C, we cannot prune graph (a) and (b).
gIndex: Indexing Graphs by Data Mining • Our methodology on graph index: • Identify frequent structures in the database, the frequent structures are subgraphs that appear quite often in the graph database • Prune redundant frequent structures to maintain a small set of discriminative structures • Create an inverted index between discriminative frequent structures and graphs in the database
IDEAS: Indexing with Two Constraints discriminative (~103) frequent (~105) structure (>106)
Why Discriminative Subgraphs? Sample database • All graphs contain structures: C, C-C, C-C-C • Why bother indexing these redundant frequent structures? • Only index structures that provide more information than existing structures (a) (b) (c)
Discriminative Structures • Pinpoint the most useful frequent structures • Given a set of structures f1, f2, …, fn and a new structure x , we measure the extra indexing power provided by x, • When P is small enough, x is a discriminative structure and should be included in the index • Index discriminative frequent structures only • Reduce the index size by an order of magnitude
Why Frequent Structures? • We cannot index (or even search) all of substructures • Large structures will likely be indexed well by their substructures • Size-increasing support threshold minimum support threshold support size
Experimental Setting • The AIDS antiviral screen compound dataset from NCI/NIH, containing 43,905 chemical compounds • Query graphs are randomly extracted from the dataset. • GraphGrep: maximum length (edges) of paths is set at 10 • gIndex: maximum size (edges) of structures is set at 10
Experiments: Index Size # OF FEATURES DATABASE SIZE
Experiments: Answer Set Size # OF CANDIDATES QUERY SIZE
Experiments: Incremental Maintenance Frequent structures are stable to database updating Index can be built based on a small portion of a graph database, but be used for the whole database
Outline • Mining frequent graph patterns • Graph indexing methods • Similairty search in graph databases • Biological network analysis • Some recent progress on graph mining
Structure Similarity Search • CHEMICAL COMPOUNDS (a) caffeine (b) diurobromine (c) viagra • QUERY GRAPH
Some “Straightforward” Methods • Method1: Directly compute the similarity between the graphs in the DB and the query graph • Sequential scan • Subgraph similarity computation • Method 2: Form a set of subgraph queries from the original query graph and use the exact subgraph search • Costly: If we allow 3 edges to be missed in a 20-edge query graph, it may generate 1,140 subgraphs
Index: Precise vs. Approximate Search • Precise Search • Use frequent patterns as indexing features • Select features in the database space based on their selectivity • Build the index • Approximate Search • Hard to build indices covering similar subgraphs—explosive number of subgraphs in databases • Idea: (1) keep the index structure (2) select features in the query space
Substructure Similarity Measure • Query relaxation measure • The number of edges that can be relabeled or missed; but the position of these edges are not fixed QUERY GRAPH …
Substructure Similarity Measure • Feature-based similarity measure • Each graph is represented as a feature vector X = {x1, x2, …, xn} • The similarity is defined by the distance of their corresponding vectors • Advantages • Easy to index • Fast • Rough measure
Intuition: Feature-Based Similarity Search Graph (G1) • If graph G contains the major part of a query graph Q, G should share a number of common features with Q Query (Q) Graph (G2) • Given a relaxation ratio, calculate the maximal number of features that can be missed ! Substructure At least one of them should be contained
Feature-Graph Matrix graphs in database features Assume a query graph has 5 features and at most 2 features to miss due to the relaxation threshold
Edge Relaxation – Feature Misses • If we allow k edges to be relaxed, Jis the maximum number of features to be hit by k edges—it becomes the maximum coverage problem • NP-complete • A greedy algorithm exists • We design a heuristic to refine the bound of feature misses
Query Processing Framework • Three steps in processing approximate graph queries Step 1. Index Construction • Select small structures as features in a graph database, and build the feature-graph matrix between the features and the graphs in the database
Framework (cont.) Step 2. Feature Miss Estimation • Determine the indexed features belonging to the query graph • Calculate the upper bound of the number of features that can be missed for an approximate matching, denoted by J • On the query graph, not the graph database