Download
1 / 12
120 likes | 122 Views
Chi-Square test is a unique sort of test that manages frequency of data rather than means as in other statistical tests. This statistical procedure is mostly used by researchers to study the differences between categorical variables among the same population. Statswork offers statistical services as per requirement of the customer. When you Order statistical Services at Statswork, we promise you the following u2013 Always on Time, outstanding customer support, and High-quality Subject Matter Experts.<br>Contact Us:<br><br>Website: www.statswork.com<br><br>Email: info@statswork.com<br><br>UnitedKingdom: 44-1143520021<br><br>India: 91-4448137070<br><br>WhatsApp: 91-8754446690<br>

E N D
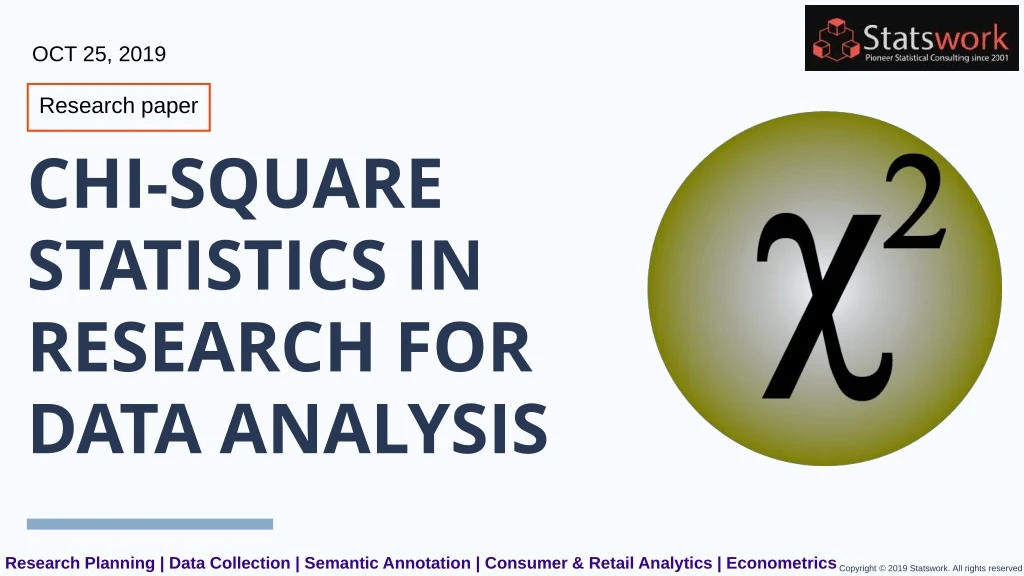
CHI-SQUARE STATISTICS IN RESEARCH FOR DATA ANALYSIS OCT 25, 2019 Research paper Research Planning | Data Collection | Semantic Annotation | Consumer & Retail Analytics | Econometrics Copyright © 2019 Statswork. All rights reserved
CHI-SQUARE TEST Chi-square test is used to address the expected vs the unexpected. It is a unique sort of test that manages frequency of data rather than means as in other statistical tests. Chi-square test often determines whether to retain the null hypothesis or the problem of the study. The relationship between the two categorical variables is tested using chi-square. Chi-square requirements to check the independence of two categorical variables are Degrees of freedom Expected frequencies Test statistic P-value Research Planning | Data Collection | Semantic Annotation | Consumer & Retail Analytics | Econometrics Copyright © 2019 Statswork. All rights reserved
EXAMPLE I love to watch horror movies. With lot of curiosity, I once inquired some of my classmates if they like to watch horror movies too. So, I gathered the data so that I could investigate it and identify some patterns. And the data I got is: Contd... Research Planning | Data Collection | Semantic Annotation | Consumer & Retail Analytics | Econometrics Copyright © 2019 Statswork. All rights reserved
By looking at the data, it would seem that both men and women watch horror movies in equal proportion. 01 However, if you look closely, it is not! This is the place where bias places a significant role. 02 INTERPRETATIONS This situation leads me to analyse the data for statistical significance. 03 04 I should use a test which deals with count data instead of mean values. To test the statistical significance for this situation, I would adapt the most widely used chi-square test . 05 Research Planning | Data Collection | Semantic Annotation | Consumer & Retail Analytics | Econometrics Copyright © 2019 Statswork. All rights reserved
PROBLEM OF CLAIM /PROBLEM STATEMENT Null Hypothesis Alternative hypothesis There is no significant difference between the movie preferences and gender. There is a significant difference between the movie preference and gender. Research Planning | Data Collection | Semantic Annotation | Consumer & Retail Analytics | Econometrics Copyright © 2019 Statswork. All rights reserved
Chi-square test statistic can be represented as Questions What is the expected mean here? How do you calculate? Research Planning | Data Collection | Semantic Annotation | Consumer & Retail Analytics | Econometrics Copyright © 2019 Statswork. All rights reserved
Let us calculate the expected frequencies for the computation purpose. • The chance of a woman who likes to watch horror movie (Women-yes) is (70/112) * (62/112) = 38.75. Likewise, other expected frequencies are calculated and found to be Women-no = 31.25, Men-yes = 23.25, and Men-no = 18.75. • Chi-square value will be 7.02 based on the formula. • To take a decision whether it is statistically significant or not. • We need to compare the value with the critical value of the distribution with the • corresponding degrees of freedom. • Degrees of freedom is calculated as (no.of rows -1) * (no.of columns -1). If the calculated value exceed the critical, then we conclude there is a lack of independence. • Thus, for this horror movies example, our calculated value is higher than the critical value with 1 degrees of freedom with 5% level of significance, leading us to reject the null hypothesis (i.e) Horror movie liking is not independent of gender. Research Planning | Data Collection | Semantic Annotation | Consumer & Retail Analytics | Econometrics Copyright © 2019 Statswork. All rights reserved
Table1: Association Between Gender and Dyslipidemia Chi-Square-4.735, **p<0.01 Figure1: The sex Distribution In Dyslipidemia • Chi-square statistic is to test the statistical significance between the observed and the expected frequencies and it is applicable only when the data is nominal in nature. • Chi-Square test is similar to the non-parametric Kolmogorov test. • Chi-square test have certain limitations: If the expected values is less an 5, then chi-square test may lead to invalid results. In addition, if there is a small sample size, chi-square test will not provide reasonable results. Research Planning | Data Collection | Semantic Annotation | Consumer & Retail Analytics | Econometrics Copyright © 2019 Statswork. All rights reserved
Table2: Association between type of deposites & marital status **p<0.01, *p<0.05 Figure2: Association Between Type of Deposits and Marital Status Research Planning | Data Collection | Semantic Annotation | Consumer & Retail Analytics | Econometrics Copyright © 2019 Statswork. All rights reserved
USES OF CHI-SQUARE TEST FOR DATA ANALYSIS Marketing company wants to identify the relationship between the customer’s geographical location and their brand preferences. In such case, chi-square plays an important role and based on the value of statistic, the company will develop their marketing strategy to different locations to make profits. Main application of chi-square statistic could be found in the medicine field. If researcher wants to identify performance of a drug with control group, then chi-square test will satisfies the needs. Likewise, there are many areas still utilizing the omnibus test statistic chi-square for identifying the relationship between two categorical outcomes. Chi-square test will be helpful for data analysis to test the homogeneity or independence between the categorical variables, or to test the goodness-of-fit of the model considered. It has the flexibility in handling two or more groups of variables. And it is used in various fields such as research field, marketing, Finance and Economic, Psychology, Medicine, etc. It is a distribution free test or simply it is a non-parametric test used for categorical data and it is more robust with respect to the distribution of the data. It doesn’t require mean or variance like in other test statistics such as t-test, F-test, ANOVA, etc. It is easy to compute and a detailed information can be obtained with this test and it is easily carried out in software like R, SAS, SPSS, etc. Research Planning | Data Collection | Semantic Annotation | Consumer & Retail Analytics | Econometrics Copyright © 2019 Statswork. All rights reserved
www.statswork.com Statswork Lab @ Statswork.com Research Planning | Data Collection | Semantic Annotation | Consumer & Retail Analytics | Econometrics Copyright © 2019 Statswork. All rights reserved
PHONE NUMBER UK : +44-1143520021 INDIA : +91-4448137070 GET IN TOUCH WITH US EMAIL ADDRESS info@statswork.com Research Planning | Data Collection | Semantic Annotation | Consumer & Retail Analytics | Econometrics Copyright © 2019 Statswork. All rights reserved