Download
1 / 25
250 likes | 339 Views
Surf Forecasting Today In search of the perfect southern hemi session. Nathan Cool www.NathanCool.com. Agenda. The pebble in the pond, forecasting principle Tools of the trade: WAMs Data Mining Weather models WAMs in-depth Forecast Accuracy

E N D
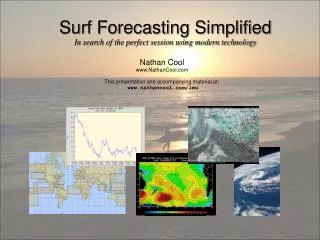
Surf Forecasting Today In search of the perfect southern hemi session Nathan Cool www.NathanCool.com
Agenda • The pebble in the pond, forecasting principle • Tools of the trade: • WAMs • Data Mining • Weather models • WAMs in-depth • Forecast Accuracy • Dissecting data (automatic data mining) • Forecasting examples, tracking SW swells • Near-term swell verification • Seasonal Surf Forecasting • Q&A and web resources
The Pebble and the Pond Ripples across the ocean The Principle • Wind (the pebble) • Transfers energy to water • Waves are created • Travel outward • Eventually reaching shore The Practice • Track ocean storms • Measure energy • Measure distance to shore • Wax your board
The Tools of the Trade Wave Analysis Models (WAMs) Model Data Weather Models
Wave Analysis Models (WAMs) • Your Tax Dollars at Work • FNMOC • NOAA • NWS
Dissecting a WAM Wave Heights Date Forecast Date Heights Scale/Key
Dissecting a WAM Periods Date Forecast Date Periods Scale/Key
The WAM Crystal Ball A model look at the future Today Sacrificing Accuracy Tomorrow 48 Hours 144 Hours
Weather Models • Your Tax Dollars, Still At Work • FNMOC • NOAA • NWS
WAM Raw Data Grabbing the middle-man Data Monitoring Mechanisms Model • Wind data (wind fields) • Sea surface temperatures • Ice concentrations • Bathymetry/obstruction data
WAM Raw Data Number Crunching Behind the Scenes For any point on the planet (“Virtual” Buoys) Thus….
WAM Raw Data Making a near-shore chart Data Charts (Near-shore estimates) Monitoring Mechanisms • Wind data (wind fields) • Sea surface temperatures • Ice concentrations • Bathymetry/obstruction data
Tracking A Southern Hemi From the Southern Ocean to SoCal • The essentials • Distance • Angle • Trajectory • Wave Height • Period
Tracking A Southern Hemi From the Southern Ocean to SoCal • Distance: ~5200 nm • Angle (A): ~210° • Trajectory (T): ~45° • Wave Height: ~36 feet • Period: 15 seconds A To SoCal T Trajectory 270 ~210 180
Tracking A Southern Hemi The Numbers for SoCal • Distance: ~5200 nm • Angle (A): ~210° • Trajectory (T): ~45° • Wave Height (Wh): ~36 feet • Period (p): 15 seconds A To SoCal T • Distance Decay (dd) = >85% • Angular Decay (ad) = ~15% • Height (h) = ((Wh – dd) – ad) • Face Height = h * (p * 0.1) • Time = Distance / (p * 1.5) Trajectory Height = (35’ – 85%) - 15% = 4.4’ Face Height = 4.4 * (15 * 0.1) = 6.6 feet Time = 5200 nm / (15 * 1.5) = 231 hours (~ 9 days)
The SW Next Week Originating 2/17/08, Hitting SoCal 2/27/08 • Distance: ~5300 nm • Angle (A): ~220° • Trajectory (T): ~30° • Wave Height (Wh): ~40 feet • Period (p): 16 seconds A To SoCal Trajectory • Distance Decay (dd) = >87% • Angular Decay (ad) = ~10% • Height (h) = ((Wh – dd) – ad) • Face Height = h * (p * 0.1) • Time = Distance / (p * 1.5) T Height = (40’ – 87%) - 10% = ~4 - 5’ *Face Height = 4 to 5 * (16 * 0.1) = 6 to 8 feet (based on 24h projection) Time = 5300 nm / (16 * 1.5) = 220 hours (~ 9 days) Height = (35’– 87%) - 10% = ~4’ *Face Height = 4* (16 * 0.1) = 6 feet max(based on 0h projection) Time = 5300 nm / (16 * 1.5) = 220 hours (~ 9 days)
The SW Next Week Shoaling Considerations 6’ 4’ Face Height = 4 * (16 * 0.1) = 6 feet max Face Height Approximations Steep Shoaling: h * (p * 0.1) Slow-sloped Shoaling: h * (p * 0.075) So… Steep Shoaling: = 4 * 1.6 = 6 foot face height Slow-sloped Shoaling) = 4 * 1.2 = 4-5 foot face Or… 4 to 6 foot face heights max (chest to head high max)
The SW Next Week Energy as it moves across the Pacific • Calculate Forerunners • Reaffirm ETA by distance • Reaffirm angle
Indicators Near-term verification by buoys
Indicators Near-term verification by CDIP Now-cast Model But, initialized at Pt. Conception 9-Period Bands Buoy history
Seasonal Forecasting Jetstream (recent January swell) • Low latitude • Strong • But slight nudge northward By comparison though…
Seasonal Forecasting Jetstream (summertime pattern) • Higher latitude • Weaker south
Seasonal Forecasting Jetstream (the SW next week) • Bending northward
Seasonal Forecasting ENSO • La Niña: weaker southern hemi jetstream • Better chance for storms to drift north • Fewer Pacific hurricanes • Better chance for Atlantic hurricanes • El Niño: stronger southern hemi jetstream • Less chance for storms to drift north • More Pacific hurricanes • Blows out Atlantic hurricanes
Q&A Presentation available at: www.WaveCast.com/groundswell Resources • FNMOC WAMs and Wx Models: https://www.fnmoc.navy.mil/public/ • NOAA WAMs: http://polar.ncep.noaa.gov/waves/main_text.html • Surf Forecast Guide: http://www.amazon.com/gp/product/059530365X • Swell Distance Calculator: http://wavecast.com/guide/distance.shtml • Distance formulas: http://www.meridianworlddata.com/Distance-Calculation.asp • WW3 Raw Data: http://polar.ncep.noaa.gov/waves/products.html • CDIP: http://cdip.ucsd.edu/ • Jetstream Analysis: http://squall.sfsu.edu/crws/jetstream.html • National Data Buoy Center: http://www.ndbc.noaa.gov/ • ENSO, Climate Prediction Center: http://www.cpc.noaa.gov/ • Free Surf Forecasts: http://WetSand.com