Download
1 / 7
80 likes | 191 Views
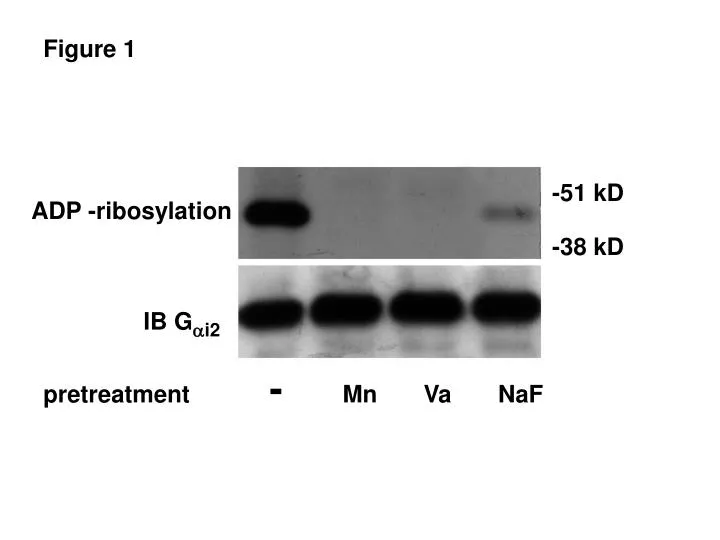
Figure 1. -51 kD. ADP -ribosylation. -38 kD. IB G a i2. pretreatment - Mn Va NaF. -121 kD. IR b. -86 kD. Figure 2. A. B. IB P-tyr. IB P-tyr. IR b. time (min) 0 2 5 10 15. GTP g S (µM) 0 0.1 1 10 100. 20. 4.

E N D
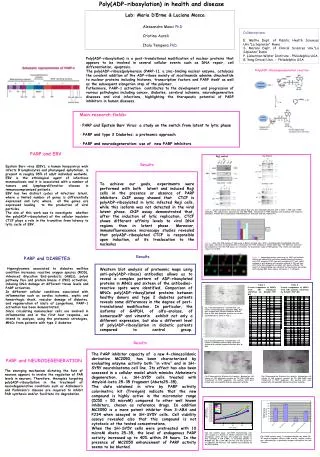
Figure 1 -51 kD ADP -ribosylation -38 kD IB Gai2 pretreatment - Mn Va NaF
-121 kD IRb -86 kD Figure 2 A B IB P-tyr IB P-tyr IRb time (min) 0 2 5 10 15 GTPgS (µM) 0 0.1 1 10 100 20 4 IR-phosphorylation densitometrie units IR-phosphorylation fold increase 10 2 0 0 0 0,1 1 10 100 0 2 5 10 15 GTPgS (µM) time (min)
. Figure 2 C D 50 4 Ins + 10 µM GTPgS Insulin + GTPgS Insulin Ins IR-phosphorylation fold increase IR- phosphorylation fold increase over baseline 2 25 0 0 0 1 10 100 0,1 insulin - - + + insulin (nM) GTPgS GTPgS - + - + - + + - E 150 100 IR- phosphorylatin % of maximum activity 50 0 0 1 10 100 GDPbS (µM)
Figure 3 A B pretreatment - ins M IR M IR M IR IB IRß IB IRb stimulation - ins - ins IB Gai IB Gai2 Gai1 Gai2 Gai3 IB Gb2 IB Gaq IB IRb p-tyr
Figure 3 C 3 coeluted Gai2/IR 2 1 0 - 0,01 0,1 1 10 pretreatment insulin (nM) D 4 IR- phosphorylation fold increasse 2 0 - 0,01 0,1 1 10 pretreatment insulin (nM)
3 2 1 0 Figure 4 A pretreatment - PTX stimulation - ins - ins 100 IR- phosphorylatin % of maximum activity IB P-tyr 50 0 PTX - + ins + + IB IRb B coeluted Gai2/IR fold increase insulin - + + PTX - - +
* Figure 5 120 * 80 IR-phosphorylation % of maximum * 40 0 pretreatment ins - - - - - - added subunits - - ai2 ao as bg ai2+bg