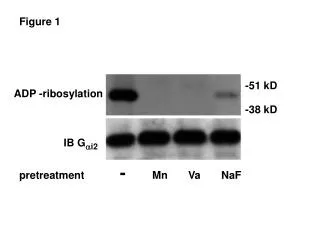
Download
1 / 38
380 likes | 572 Views
Shining Light on the ADP-Ribosylation Mechanism of Pseudomonas Toxin. A.R. Merrill Dept. of Chem. & Biochem. Univ. of Guelph. Guelph, Ontario, Canada. P. aeruginosa. ubiquitous, Gram-neg bacterium --Pathogenic cystic fibrosis, cancer, burn, AIDS, and post-operative patients

E N D
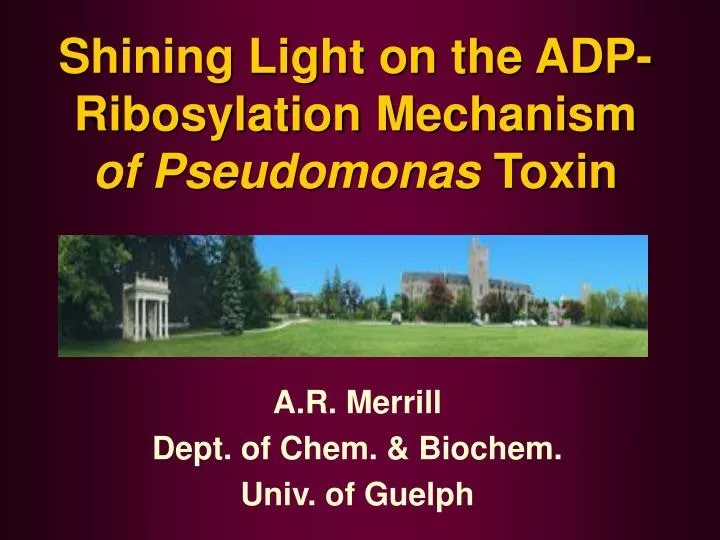
Shining Light on the ADP-Ribosylation Mechanism of Pseudomonas Toxin A.R. Merrill Dept. of Chem. & Biochem. Univ. of Guelph
P. aeruginosa • ubiquitous, Gram-neg bacterium--Pathogenic • cystic fibrosis, cancer, burn, AIDS, and post-operative patients • infections: acute localized to systemic • leukopenia, circulatory collapse, liver, kidney, and skin necrosis, hemorrhaging, corneal destruction, and pneumonia • most virulent factor--Exotoxin A (Dennis Kunkel; Microscopy, 2001)
Exotoxin A • 66 kDa protein secreted by P. aeruginosa • LD50 = 0.2 mg/kg (mice) • mono-ADPRT enzyme • related to diphtheria, cholera, tetanus, pertussis toxins, PARPs • cellular effect: inhibition of protein synthesis by alteration of elongation factor 2 (eEF2)
Crystal Structure of ETA Domain Ib Domain II Domain Ia Domain III (Wendekindet al., JMB 2001)
ADPRT Reaction NAD+ eEF2 diphthamide residue + H+ nicotinamide ADP-ribosylated eEF2 diphthamide residue
-TAD His440 Tyr470 Tyr481 Glu553 Catalytic Domain of ETA (PE24) (Li et al (1996) PNAS 93:6902)
Eukaryotic Elongation Factor 2 • eEF2 is a soluble 94-97 kDa • Forms binary complexes with guanine nucleotides • Complex formation conformation change in eEF2 bind with high affinity to ribosomes • eEF2 catalyzes the translocation of peptidyl-tRNA on the ribosome in protein elongation 17.5Å EM Structure tRNA Gomez-Lorenzo et al., 2000
Structure of Yeast eEF2 Diphthamide IV (Jorgensen et al., Nat. Struct. Biol. 10, 387-385, 2003)
A diphthamide residue is the site of regulatory modification on eEF2 eEF2 a substrate for cellular ADPRTs which function to regulate protein synthesis as part of normal metabolism Bacterial toxins exploit the existing system O NH N +N(CH3)3 NH O H2N diphthamide Regulation of eEF2
ADPRT Reaction + + NAD eEF2 eEF2~ADPR Nic + H + + E E-NAD E-NAD ~eEF2 E-Nic~eEF2~ADPR E- Nic E k k k 3 1 + + 2 + E + NAD E-NAD E-NAD ~eEF2 E-Nic~eEF2~ADPR k k k -3 -1 -2 k k k k 4 -4 5 -5 E- Nic eEF 2~ADPR
Protein Fluorescence Tyr Trp Phe (Lakowicz, 1983)
Tryptophan Fluorescence • The intrinsic probe of choice for protein studies: • absorption and emission distribution extend further • strongest absorbance • large fluorescence intensity • most sensitive to local environment • Sensitivity due to 10 p electrons of indole ring • 1La and 1Lb transitions • dipole
ETA Kinetic Parameters Armstrong & Merrill (2001) Anal. Biochem.292, 26-33.
Steady State Fluorescence • Change in fluorescence intensity as a function of substrate/ligand concentration 1.0 - Fi Fi/Fmax [ligand] [ligand]
NAD Binding Kd=50 mM Armstrong & Merrill, Biochemistry, in press
Stopped Flow Fluorescence • Kinetic data fit to exponentials: • Single exponential • Multiple exponential
Ala Scan of Loop C (483-490) * Ala Arg 1.0 0.8 Glu cat 0.6 Relative k Pro 0.4 * Gln * Yates & Merrill (2001) JBC 276,35029 * * 0.2 Asp Gln Asp 0.0 483 484 485 486 487 488 489 490 Residue Number
eEF2 Docking Site Loop C PE24
Toxin:eEF2 Interaction Models • Identification of the contact sites between eEF2 and the catalytic domain of ETA (PE24) • currently, this protein-protein interaction is poorly characterized • Two extreme models are possible • Minimal Contact Model – Maximum Contact Model PE24 eEF2 eEF2 PE24
A-519 G-525 S-515 O G-549 Q-603 E-486 I A-476 NHCH CH NH C CH 2 2 2 T-554 R-490 T-442 S-459 S-507 N-577 S-585 T-564 S-410 SO H S-408 3 Q-592 Q-415 S-449 Q-428 Experimental Approach • Single cysteine residuesintroducedinto PE24 at 21 defined sites andlabeled with the fluorophore, IAEDANS • fluorescence studies performed in the presence and absence of eEF2 • acrylamide quenching • fluorescence lifetime • wavelength emission maximum
Emission Max and Lifetime • No large shifts in l emission maxima after eEF2 added • 3 nm red shift for S449C-AEDANS and S515C-AEDANS • 1 nm blue shift for A519C-AEDANS • No large changes in fluorescence lifetime after eEF2 added • Q428C-AEDANS (-1.2 ns) • A519C-AEDANS (1.2 ns)
Fluorescence Lifetime Measurements • = 1/(kF + knF) • I(t) = I0e(-t/t) for a single exponential (one lifetime component) • I(t) =1e(-t/1) + 2e(-t/2) + … for multiple exponentials (multiple lifetime components)
Acrylamide Quenching 9 - 1 - 1 9 - 1 - 1 k x 10 M s k x 10 M s q q Protein ( eEF 2) (+ eEF 2) – 1 S408C 1.03 0.02 0.37 0.01 ± ± • Measure the ability of acrylamide to quench the fluorescence of AEDANS probe • determine the bimolecular quenching constant (kq) in the presence and absence of eEF2 • Stern-Volmer equation 2 S410C 1.29 0.01 0.36 0.01 ± ± 3 Q415C 1.28 0.04 0.73 0.01 ± ± 4 Q428C 0.86 0.03 0.54 0.01 ± ± 5 T442C 0.56 0.02 0.20 0.01 ± ± 6 S449C 0.60 0.02 0.27 0 .01 ± ± 7 S459C 0.94 0.03 0.42 0.02 ± ± 8 A476C 0.89 0.03 0.58 0.01 ± ± 9 E486C 1.29 0.04 0.48 0.02 ± ± 10 R490C 1.27 0.04 0.70 0.02 ± ± 11 S507C 0.80 0.02 0.33 0.01 ± ± 12 S515C 0.55 0.03 0.41 0.01 ± ± 13 A519C 1.23 0.04 0.61 0.02 ± ± 14 G525C 0.96 0.01 0.75 0.02 ± ± 15 G549C 0.65 0.03 0.35 0.01 ± ± F0/Fi KSV 16 T554C 0.88 0.04 0.32 0.01 ± ± 17 T564C 0.50 0.02 0.27 0.01 ± ± 18 N577C 1.10 0.04 0.74 0.01 ± ± 19 S585C 0.90 0.02 0.59 0.01 ± ± 1.0 20 Q592C 1.42 0.02 0.79 0.01 ± ± [Q] 21 Q603C 0.68 0.02 0.39 0.01 ± ±
Acrylamide Quenching Protein k (+ eEF 2) / q Adduct k ( – eEF 2) q S410C 3.53 S408C 2.79 T442C 2.77 T554C 2.74 E486C 2.69 S507C 2.44 S459C 2.26 S449C 2.25 A519C 2.04 T564C 1.85 R490C 1.82 G549C 1.79 Q592C 1.79 Q415C 1.75 Q603C 1.75 Q428C 1.60 A476C 1.54 S585C 1.54 N577C 1.48 S515C 1.34 G525C 1.28
Model of PE24-eEF2 Complex eEF2 • Potential eEF2 contact sites on PE24 are shown as green spacefilled structures • minimal contact between proteins • diphthamide residue on eEF2 positioned near scissile glycosidic bond of NAD+ in active site • two negative electrostatic patches on toxin and two positive electrostatic patches on eEF2 are aligned Domain IV a b Diphthamide 7 3 c d 4 6 5 2 8 PE24 1 9 Jørgensen, et al., (2003) Nat. Struc. Biol. 10, 379-385 (eEF-2 structure); Li et al (1996) PNAS 93, 6902 (PE24 structure)
FRET Experiments R=Ro(E-1-1)1/6 E=1-FDA/FD Ro=(K2JDAQDn-4)1/6 (9.79x10³) Å
Using FRET to Study eEF2 Binding to ETA • Fluorescence Resonance Energy Transfer (FRET) • transfer of excited state energy from a donor to an acceptor • no emission of a photon • Criteria • donor and acceptor must be in close proximity (10 – 100 Å) • absorbance spectrum of acceptor overlaps fluorescence emission spectrum of donor • dipole-dipole interactions are parallel PE24- AEDANS eEF2- Fluorescein
Labeling eEF2 with Fluorescein (Acceptor) O HO O O HO O + HI C OH Fluorescein C OH Protein adduct O O NH CH C I 2 NH CH S CH eEF2 C 2 2 .. CH eEF2 HS 2
PE24-AEDANS Binding with eEF2-5AF • Created S585C mutant toxin (WT activity) • labeled Cys at 585 with IAEDANS • Dissociation constant (Kd) • S585C-AEDANS • 0.71 ± 0.08 mM (Armstrong et al. (2002)JBC277:46669)
FRET Approach T812C T574C Diphthamide eEF2 PE24
Future Work • Determine kinetic mechanism for mono- ADPRTs • Study movement of Loop C during catalysis • Develop inhibitors of ETA (competitive) • Crystallize PE24:inhibitor complexes • Characterize the nature of protein—protein interaction between ETA and eEF2 • FRET Lifetime Analysis • Crystallize eEF2/bTAD+/PE24 complex
Gerry Prentice Monica Tory Bryan Beattie Dr. Souzan Armstrong Susan Yates Dave Teal Patricia Taylor Dr. Jon Lamarre (U of Guelph) Dr. Art Szabo (WLU) Dr. David FitzGerald (NIH) Dr. Victor Marquez (NIH) Dr. Gilles Lajoie (UWO) Funding CIHR CCFF NSERC Acknowledgments


![Read ebook [PDF] Shining Light on Health: The Power of Photobiomodulation](https://cdn7.slideserve.com/12529511/slide1-dt.jpg)
![[PDF] DOWNLOAD Shining Light on Health: The Power of Photobiomodulation full](https://cdn7.slideserve.com/12532645/shining-light-on-health-the-power-dt.jpg)