Download
1 / 18
190 likes | 200 Views
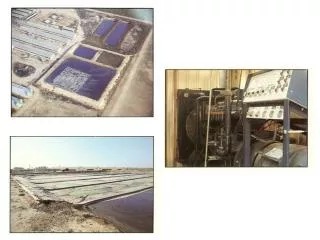
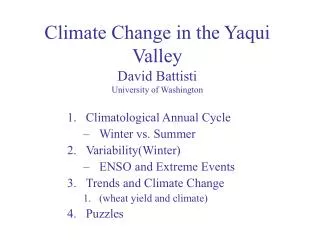
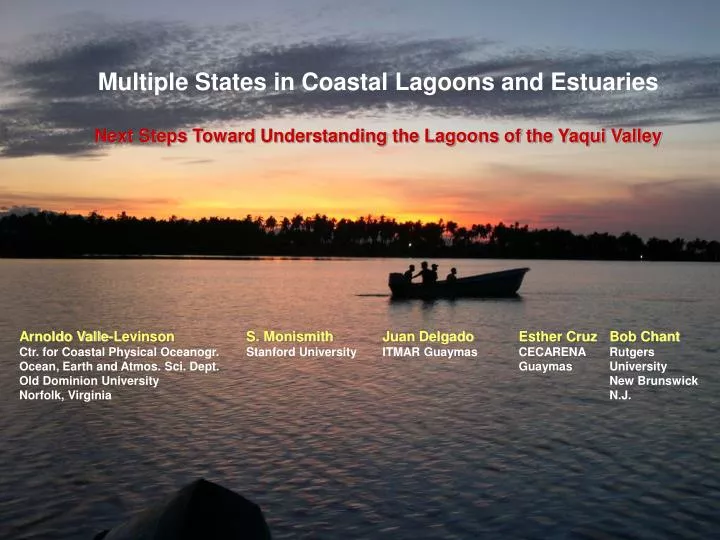
Multiple States in Coastal Lagoons and Estuaries Next Steps Toward Understanding the Lagoons of the Yaqui Valley. Arnoldo Valle-Levinson S. Monismith Juan Delgado Esther Cruz Bob Chant Ctr. for Coastal Physical Oceanogr. Stanford University ITMAR Guaymas CECARENA Rutgers

E N D
Multiple States in Coastal Lagoons and Estuaries Next Steps Toward Understanding the Lagoons of the Yaqui Valley Arnoldo Valle-Levinson S. Monismith Juan Delgado Esther Cruz Bob Chant Ctr. for Coastal Physical Oceanogr. Stanford University ITMAR Guaymas CECARENA Rutgers Ocean, Earth and Atmos. Sci. Dept. Guaymas University Old Dominion University New Brunswick Norfolk, Virginia N.J.
Depends on density contrast (From Hearn and Sidhu, 2003) When and how does the system switch?
IN Guaymas Bay OUT Inverse Estuary OUT OUT IN Classical Estuary Looking into the lagoon Red = outflow Blue = inflow
Wet Season: Classical Dry Season: Inverse Neap Tides Distance from Transect Origin (km) Mean Flow at Transect 4 red is inflow; blue is outflow (looking seaward) Interface slope, spring tides ~ 2.5e-03 (25 m in 10 km) Interface slope, neap tides ~ 2.0e-03 (18 m in 9 km) IN OUT IN OUT Importance: Water and Soil(?) Quality Climate Variability
The Global Heat and Salt Conveyor Belt (From Broecker,1990; in Pinet, 1998)
Heating Precipitation Freshwater Se, Te Outflow Q So, To Inflow Cooling Evaporation Freshwater So, To Inflow Se, Te Q Outflow INVERSE Conservation of Salt and Heat CLASSICAL Relative influence of salinity and temperature on density gradients
In reality: Relative influence of salinity and temperature on density gradients Temperature influence Net influence Salinity influence Q
Multiple states --- Stommel Transitions T mode Temperature influence Net influence S mode Salinity influence Q
Response dominated by temperature Response dominated by salinity
Critical response for multiple states Temperature influence Net influence Salinity influence Q Guess for Tobari and Lobos
(Indicates Evaporation) (From Hearn and Sidhu, 2003)
(Indicates Evaporation) (From Hearn and Sidhu, 2003)
L = 15 km L = 0.85*15 km (Indicates Evaporation) (From Hearn and Sidhu, 2003)
Shortening basin may prevent it from becoming INVERSE (From Hearn and Sidhu, 2003)
Do Yaqui Valleylagoons/estuaries show ‘Stommel Transitions’? What is the time scale of the Transitions? Does causeway prevent INVERSE conditions? Are the systems in the Yaqui Valley more VULNERABLE to drought? Implications for water and soil quality… Natural laboratory to examine climate variations