Download
1 / 114
1.14k likes | 1.15k Views
Single Cell Thunderstorms. METR 4433 Mesoscale Meteorology Spring, 2006 Semester Adapted from Materials by Drs. Frank Gallagher III, Kelvin Droegemeier and Ming Xue School of Meteorology University of Oklahoma. Textbook materials for reading. Bluestein Vol II pp. 444-462 Houze pp. 35-37

E N D
Single Cell Thunderstorms METR 4433Mesoscale MeteorologySpring, 2006 SemesterAdapted from Materials by Drs. Frank Gallagher III, Kelvin Droegemeier and Ming XueSchool of MeteorologyUniversity of Oklahoma
Textbook materials for reading • Bluestein Vol II pp. 444-462 • Houze pp. 35-37 • Cotton and Anthes p. 455-458
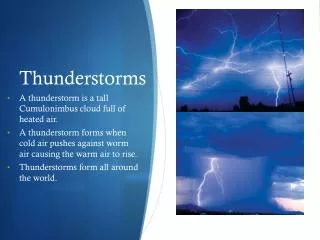
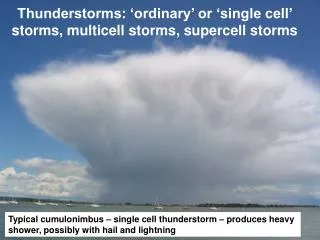
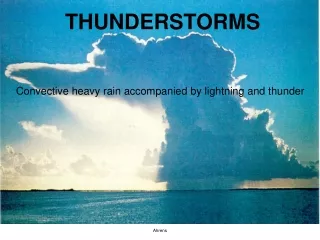
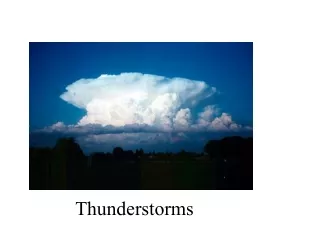
Thunderstorm • Definition: By definition, a thunderstorm is a local storm, invariably produced by a cumulonimbus cloud, that always is accompanied by lightning and thunder. It usually contains strong gusts of wind, heavy rain, and sometimes hail. Meteorologists often use the word "convection" to describe such storms in a general manner, though the term convection specifically refers to the motion of a fluid resulting in the transport and mixing of properties of the fluid. To be more precise, a convective cloud is one which owes its vertical development, and possibly its origin, to convection (upward air currents).
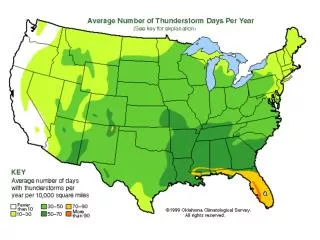
Thunderstorm Climatology • At any given time there are an estimated 2000 thunderstorms in progress, mostly in tropical and subtropical latitudes. About 45,000 thunderstorms take place each day. Annually, The U.S. experiences about 100,000 thunderstorms. About 16 million thunderstorms occur annually around the world!
Hail Days Climatology Courtesy H. Brooks, National Severe Storms Laboratory
Wind Days Climatology Courtesy H. Brooks, National Severe Storms Laboratory
Modes of Convection / Storm Classification • Although a continuous spectrum of storms exists, meteorologists find it convenient to classify storms into specific categories according to their structure, intensity, environments in which they form, and weather produced.
Basic Classification • Single-cell or air-mass storm Typically lasts 20-30 minutes. Pulse storms can produce severe weather elements such as downbursts, hail, some heavy rainfall and occasionally weak tornadoes. • Multicell cluster storm A group of cells moving as a single unit, with each cell in a different stage of the thunderstorm life cycle. Multicell storms can produce moderate size hail, flash floods and weak tornadoes. • Multicell Line (squall line) Storms - consist of a line of storms with a continuous, well developed gust front at the leading edge of the line. Also known as squall lines, these storms can produce small to moderate size hail, occasional flash floods and weak tornadoes. • Supercells Defined as a thunderstorm with a rotating updraft, these storms can produce strong downbursts, large hail, occasional flash floods and weak to violent tornadoes.
Convection and Buoyancy • Convection: transport of fluid properties by motions within that fluid • Buoyancy: vertically oriented force on a parcel of air due to density differences between between the parcel and surrounding air • Mathematically, the buoyancy force can be derived from the vertical equation of motion • Let’s derive it now!
Perturbation Vertical Momentum Equation (we just derived a very similar form) where L = liquid+ice water content. Note that the water vapor contributes to the buoyancy of air parcel and the combined effect can be expressed in terms of virtual potential temperature in the formulation we derived
Key Ingredients for Thunderstorms Static Instability Cold Air Warm Air Cold Dry Air Warm Moist Air
Convective Available Potential Energy (CAPE) • CAPE measures the amount of convective instability, or more accurately the potential energy of an environmental sounding – the energy that can be converted into kinetic energy when an air parcel rises from LFC to EL • It is based on simple parcel theory which neglects the effect of mixing/friction, PGF and sometimes water loading. (The vertical momentum equation becomes simply Dw/Dt = B) • From CAPE, we can estimate the maximum vertical velocity that can be reached by a parcel
CAPE on a Skew-T diagram • The positive area (where air parcel is warmer than environment) is equal to CAPE • Lifted Index – temperature excess in 500mb environment over that of a parcel lifted from the low ‘moist’ layer (negative value indicates instability)
LCL – Lifting condensation level LFC – Level of free convection – level at which the parcel is warmer than the Environment EL – Equilibrium Level – level at which the parcel’s T becomes the same as the environment again
Skew-T analysis and Parcel Theory • Skew-T analysis and Parcel Theory typically neglect the effect of PGF induced by vertical motion, essentially they assume that the environment is unchanged by the parcel motion. They also neglect the effect of mixing/friction • Therefore, parcel theory tends to overestimate the intensity of the updraft. Still, it provides a useful upper limit for the convection intensity.
CIN • Convective Inhibition • The “negative area” on a thermodynamic diagram, or the area between the lifted surface parcel and ELR curves, in the layer where the parcel is colder than the environment. • It is defined as the amount of energy beyond the normal work of expansion need to lift a parcel from the surface to the Level of Free Convection (LFC).
How Can CAPE Increase? • Hotter surface temperature • More low-level moisture • Cool the mid-levels
Td T
Key Ingredients for Thunderstorms Vertical Wind Shear; Change in wind speed and/or direction with height; Severe storms needstrong veering of wind with height and strong increase in speed
Environmental Shear • CAPE and Vertical Environmental Wind Shear are the two most important factors in determining storm type • Numerical models have been very effective tools to aid our understanding of such effects • In general, single cell storms occur in environments with little vertical shear ( < 15 m/s over lowest 6 km) • Multicell storms occur in environments with moderate vertical shear (15 – 25 m/s) • Supercell storms occur in environments with strong vertical shear ( > 25 m/s)
Numerical Experiments of Weisman and Klemp (1982) Vertical wind profiles with unidirectional shear of different magnitudes Time series of max w for 5 experiments Supercell behavior is observed with us =25, 35 and 45m/s cases – quasi-steady updraft is found
Results from us = 15m/s and 35 m/s cases • Multicell case (left) with u =15 m/s and supercell case (right) with u = 35m/s. • Only the southern half of the computational domain is shown because the fields are symmetric about the central E-W axis • The storm splitting is a result of rotational storm dynamics (more later). The member that moves to the right of vertical shear vector is called right mover, and the other the left mover. • When the shear is not unidirectional, i.e., when shear changes direction with height, one of the members will be favored, again due to rotational storm dynamics
Maximum w as a function of CAPE and shear • The vertical axis is the low-level qv – higher value corresponds to higher CAPE • First cell intensity increases with CAPE and decreases with shear • Second cell occurs only with moderate shear. • Supercell storm occurs in stronger vertical shear. • Strong updrafts can survive in supercells because of the support of pressure perturbations associated with vertical rotation which initially comes from horizontal vorcitity in the environment via tilting. Multicell case Supercell case
Predicting Thunderstorm Type: The Bulk Richardson Number • The Bulk Richardson Number, BRN, is a measure of the relative importance of environmental instability effects to environmental shear effects • Essentially the ratio of the KE of the updraft to the KE of the inflow • Denominator is really the storm-relative inflow kinetic energy (sometimes called the BRN Shear) • Large values associated with single-cell “pulse storms” • Smaller values associated with supercells (~ 10 – 20) • Must be used with caution. If CAPE and shear both low, can still get “supercell” values of R, but storms will be weak, if they form at all.
Key Ingredients for Thunderstorms • Mechanism to trigger the instability • Front • Terrain • Dryline • Daytime heating • Landmass inhomogeneities
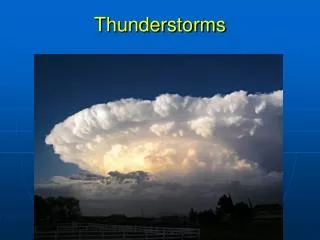
Types of Thunderstorms • Ordinary single storms • Most common • Last for less than an hour • Built-in self-destruct mechanism! • Occur all year long, mostly in summer • Can produce strong winds, hail, and lightning
Ordinary Single (Airmass) Storms • First studied just after World War II • Many commercial and military aircraft accidents • Newly developed radar was exploited for weather studies • The Thunderstorm Project • Resulted in first life cycle of a thunderstorm • Air mass thunderstorms are also referred to as “Garden Variety!”
This is a single cell storm, looking east from about 15 miles. The storm was moving east (into the photo). Some of the anvil cloud has been left behind the storm, but the greater portion of the anvil is blowing off in advance of the storm and is not observable from this perspective. (May storm in the Texas Panhandle near Amarillo.) Photograph by: NSSL
This late May storm in Oklahoma, looking northeast from about 20 miles, occurred with weak to moderate vertical wind shear. It did not produce any severe weather.
Conditions of Formation of Air Mass Thunderstorms • Conditional instability (we’ll come to that later) • Warm, moist air near the ground • Localized source of lift (usually thermally driven) • Weak or no environmental vertical wind shear
Three stages of single-cell storm development Developing stage Mature Stage Dissipating Stage
Example of Single-cell Life Cycle (a) – Developing (c) Mature (b) – Mature (d) – Dissipating
Cumulus Phase • Development of towering cumulus • Region of low level convergence • Warm moist air • Updraft driven by latent heating • Nearby cumulus may merge to form a much larger cloud • Dominated by updraft • Mixing and entrainment occur in the updraft
Cumulus Phase c David Shohami c William Zender (2001)
Development of a Single-Cell Storm Step 1 • In the absence of frontal or other forcing, daytime heating of the PBL causes the convective temperature to be reached. Thus, there is no ‘negative area’ on the skew-T diagram for an air parcel rising from the surface – the lid is broken
Development of Single Cell Storm Step 2 • Updraft forms – once the air reaches the LCL, latent heat is released due to condensation: - L dqv = Cp dT • For every 1g/kg of water condensed, the atmosphere warms about 3 degrees. This feeds into the buoyancy term through an increase in q’ (remember earlier vertical momentum equation?). The saturated air parcel ascends following the moist adiabat, along which the equivalent potential temperature qe is conserved. • Until the ‘Equilibrium level’ is reached, the air parcel is warmer than the environment, which keeps the buoyancy positive (without the effect of water loading – see later)
Development of Single Cell Storm Step 2 – continued … • When a cloud forms, some of it is carried upward by the draft and some moves out of the updraft. The ‘weight’ of this liquid water makes the air parcel heavier, this ‘water loading’ effect acts to reduce the positive buoyancy. B = g(q’/q) - g L 10 x 3/300 ~ - 10 x 0.01 kg/kg Therefore 10 g/kg of cloud or rain water will offset a 3 K temperature surplus.
Entrainment • Entrainment is the process by which saturated air from the growing cumulus cloud mixes with the surrounding cooler and drier (unsaturated) air. • Entrainment causes evaporation of the exterior of the cloud and tends to reduce the upward buoyancy there.