Download
1 / 19
200 likes | 366 Views
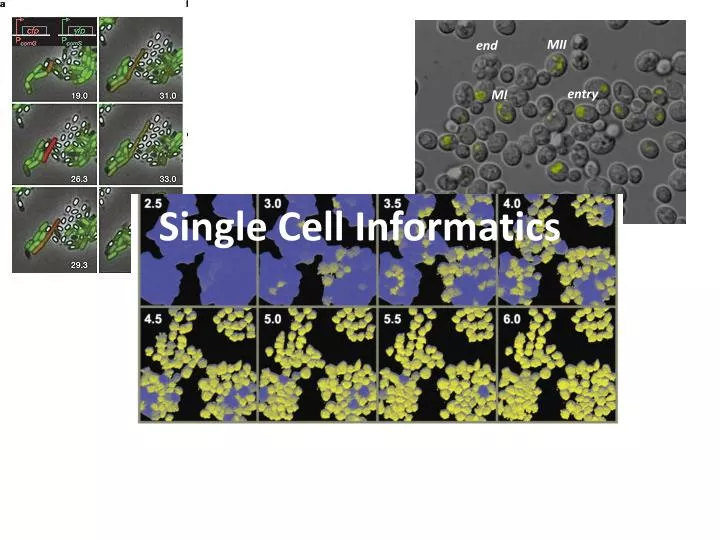
MII. end. entry. MI. Single Cell Informatics. Motivation. Some phenomena can only be seen when filmed at single cell level! (Here: excitability). Outline. Motivation: Similar cells respond differently most methods don’t see that: uarrays, gels, blots Possible reasons:

E N D
MII end entry MI Single Cell Informatics
Motivation Some phenomena can only be seen when filmed at single cell level! (Here: excitability)
Outline • Motivation: Similar cells respond differently • most methods don’t see that: uarrays, gels, blots • Possible reasons: • The cells are actually not similar • molecular “noise” • How can we tell? Look at single cells! • Imaging • Image analysis • Statistical analysis/model fitting • Examples • Yeast meiosis • Apoptosis • Competence in bacteria
filamentation apoptosis differentiation sporulation Decision making in cells:switching from one state to another signal cell state change Similar cells respond differently to the same signal What can lead to variable responses? The cells differ in some aspects (type, size, …) Molecular “noise”
Most methods average over cells end MII entry westerns MI microarrays meiosis marker How can we study this? Need to follow manysingle cellsover time along the process But how do we track molecular levels in living cells?
The GFP revolution • Allows tagging and monitoring a specific protein in vivo • Different variants/colors allow multiple tagging in the same cell.
Example: Yeast entry into meiosis Difference between cells: time of decision starvation meiosis meiosis & sporulation
MI MII end replication meiosis commitment new nutrients Yeast have a decision point cell cycle starvation • When do cells commit? • What controls this timing and variability?
Regulation of entry into meiosis nitrogen signals acetate glucose Ime1 master regulator early genes transcriptional program middle genes We can fluorescently tag different levels along this pathway! late genes
early gene YFP 30-50 positions, every 5-10 min (1000-4000 cells/experiment) t DIC images YFP images rich medium Custom image analysis poor medium Annotation of events+more Approach: live cell imaging • Controlled temperature, flow
Image analysis steps • Cell segmentation • Cell tracking • Fluorescent signal measurement These have to be tailored to cell type, motility, signal location, etc.
1) Identify Cells 3) Identify *FP “blobs” 2) Map cells between time points 4) Map blobs to cells identified # cells cell mapped t t Example: Image analysis for yeast nuclear signals
MII MI Results of image analysis • Intensities • Num of signals • Distance • Cell Size • Large number of single cells over time • Automated experiment + post-process • In silico synchronization,elutriation YFP level Time 5) Event timing detection
early genes↑ tearly Data extraction: timing distributions tMI tMII Time “wait” progress tearly = onset time of early meiosis genes
last mitosis tearly 6.3±2.3hr 11.1±2.2hr Two-color use for event annotation Adding another fluorescent marker allows annotating more events. Hypothesis: meiosis entry is determined by last mitosis Htb2-mCherry ▄▄Dmc1-YFP ▄▄ t nutrient shift Conclusion: Countdown to meiosis occurs in parallel to the cell cycle t
tearly Two colors: level vs. timing regulator Regulator promoter activity early genes t early promoter activity Regulator promoter activity affects entry time Molecular “noise” → spread in decision times
Model of causative effects cell size cell cycle phase 40% nutrient signals pIME1 activity 35% onset time of early genes 80% decision time Large number of single cell measurements let us build a model of causative links between molecular levels, phenotypes, event timings.
Comparing two promoter activities The time tracks verify the circuit model: The red and green genes are anti-correlated
Summary • Similar cells behave differently • molecular noise, non-molecular factors • Quantitative fluorescent time lapse microscopy • Follow single cells over time • Track protein levels/promoter activities in them • Test dynamics of circuits (network motifs) • Test dependencies between molecular levels, event times, morphological properties