Download
1 / 20
200 likes | 203 Views
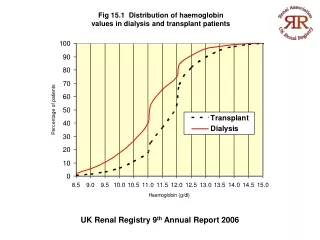
This report analyzes the percentage of renal patients with serum phosphate and corrected calcium levels below target range, as well as their median levels. It also examines the percentage of patients within the KDOQI reference range for calcium phosphate product. Data from the UK Renal Registry 9th Annual Report (2006) is used to highlight trends and changes over the years.

E N D
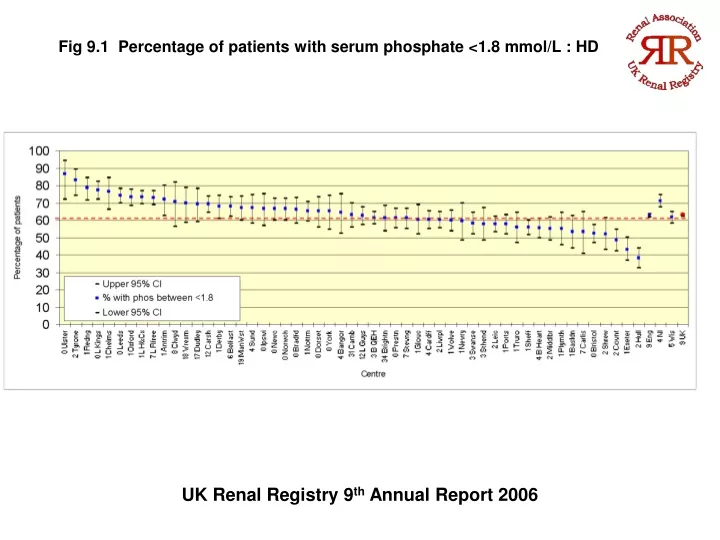
Fig 9.1 Percentage of patients with serum phosphate <1.8 mmol/L : HD UK Renal Registry 9th Annual Report 2006
Fig 9.2 Percentage of patients with serum phosphate <1.8mmol/L : PD UK Renal Registry 9th Annual Report 2006
Fig 9.3 Percentage with serum phosphate < 1.8mmol/L 1999 - 2005 UK UK Renal Registry 9th Annual Report 2006
Fig 9.4 Median serum phosphate mmol/L: Transplant UK Renal Registry 9th Annual Report 2006
Fig 9.5 Funnel plot for percentage achievement of phosphate <1.8mmol/L: HD UK Renal Registry 9th Annual Report 2006
Fig 9.6 Percentage of patients with corrected calcium within 2.2 to 2.6 mmol/L : dialysis UK Renal Registry 9th Annual Report 2006
Fig 9.7 Change in percentage of patients achieving serum corrected calcium 2.2-2.6mmol/L 1999 - 2005 UK UK Renal Registry 9th Annual Report 2006
Fig 9.8 Percentage of patients with corrected calcium within 2.2 to 2.6 mmol/L : transplant UK Renal Registry 9th Annual Report 2006
Fig 9.9 Median corrected calcium : transplant UK Renal Registry 9th Annual Report 2006
Fig 9.10 Calcium phosphate product within KDOQI ref: dialysis UK Renal Registry 9th Annual Report 2006
Fig 9.11 Percentage of patients with calcium phosphate product in KDOQI reference range : haemodialysis UK Renal Registry 9th Annual Report 2006
Fig 9.12 Percentage of patients with calcium*phosphate product in KDOQI reference range: peritoneal dialysis UK Renal Registry 9th Annual Report 2006
Fig 9.13 Change in percentage of patients achieving serum corrected calcium X phosphate product target 1998 - 2005 UK UK Renal Registry 9th Annual Report 2006
Fig 9.14 Median iPTH in dialysis patients UK Renal Registry 9th Annual Report 2006
Fig 9.15 Percentage of patients on dialysis with iPTH < 32 pmol/L UK Renal Registry 9th Annual Report 2006
Fig 9.16 Percentage of patients with cholesterol < 5 mmol/L: HD UK Renal Registry 9th Annual Report 2006
Fig 9.17 Percentage of patients with cholesterol <= 5 mmol/L: PD UK Renal Registry 9th Annual Report 2006
Fig 9.18 Percentage of patients with cholesterol < 5 mmol/L: transplant UK Renal Registry 9th Annual Report 2006
Fig 9.19 Serum cholesterol distribution by modality 31/12/2005 UK Renal Registry 9th Annual Report 2006
Fig 9.20 Percentage of patients with cholesterol < 5 mmol/L: HD vs PD vs Tx 1997 - 2005 UK Renal Registry 9th Annual Report 2006