Download
1 / 6
60 likes | 66 Views
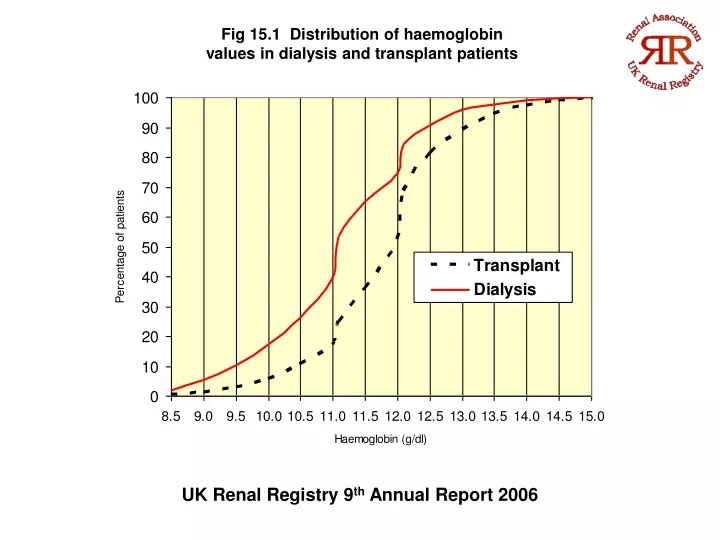
Fig 15.1 Distribution of haemoglobin values in dialysis and transplant patients. UK Renal Registry 9 th Annual Report 2006. Fig 15.2 Haemoglobin in dialysis and transplant patients. UK Renal Registry 9 th Annual Report 2006.

E N D
Fig 15.1 Distribution of haemoglobin values in dialysis and transplant patients UK Renal Registry 9th Annual Report 2006
Fig 15.2 Haemoglobin in dialysis and transplant patients UK Renal Registry 9th Annual Report 2006
Fig 15.3 Haemoglobin against eGFR in paediatric allograft recipients UK Renal Registry 9th Annual Report 2006
Fig 15.4 Distribution of Hb values according to eGFR UK Renal Registry 9th Annual Report 2006
Fig 15.5 Haemoglobin (Hb) and the use of Mycophenolate (MMF) UK Renal Registry 9th Annual Report 2006
Fig 15.6 The distribution of Hb values in dialysis patients UK Renal Registry 9th Annual Report 2006