Download
1 / 9
90 likes | 93 Views
A simple spectrofluorometric method has been developed, adapted, and validated for analysis of certain drugs containing active methylene group adjacent to carbonyl functional group. This method was applied successfully for quantitative determination of drugs having cyclic u2022-methylene carbonyl groups in a cyclohexanone, cycloheptanone and macromolecular structures such as Naltrexone (I), Ketotifen (II), Oxcarbazepine (III) and Pimecrolimus (IV) respectively in various pharmaceutical dosage forms. The fluorescence of the productsresulting from the reaction between tested drugs and N1-methylnicotinamide chloride (NMNCl) have been measured in pure pharmaceutical ingredient, laboratory-prepared mixtures, pharma- ceutical dosage forms and spiked human plasma samples. The developed method isin line with all current compendial criteria. The proposed method is simple, with low instrumentation requirements, suitable for quality control application, bioavailability and bioequivalence studies.

E N D
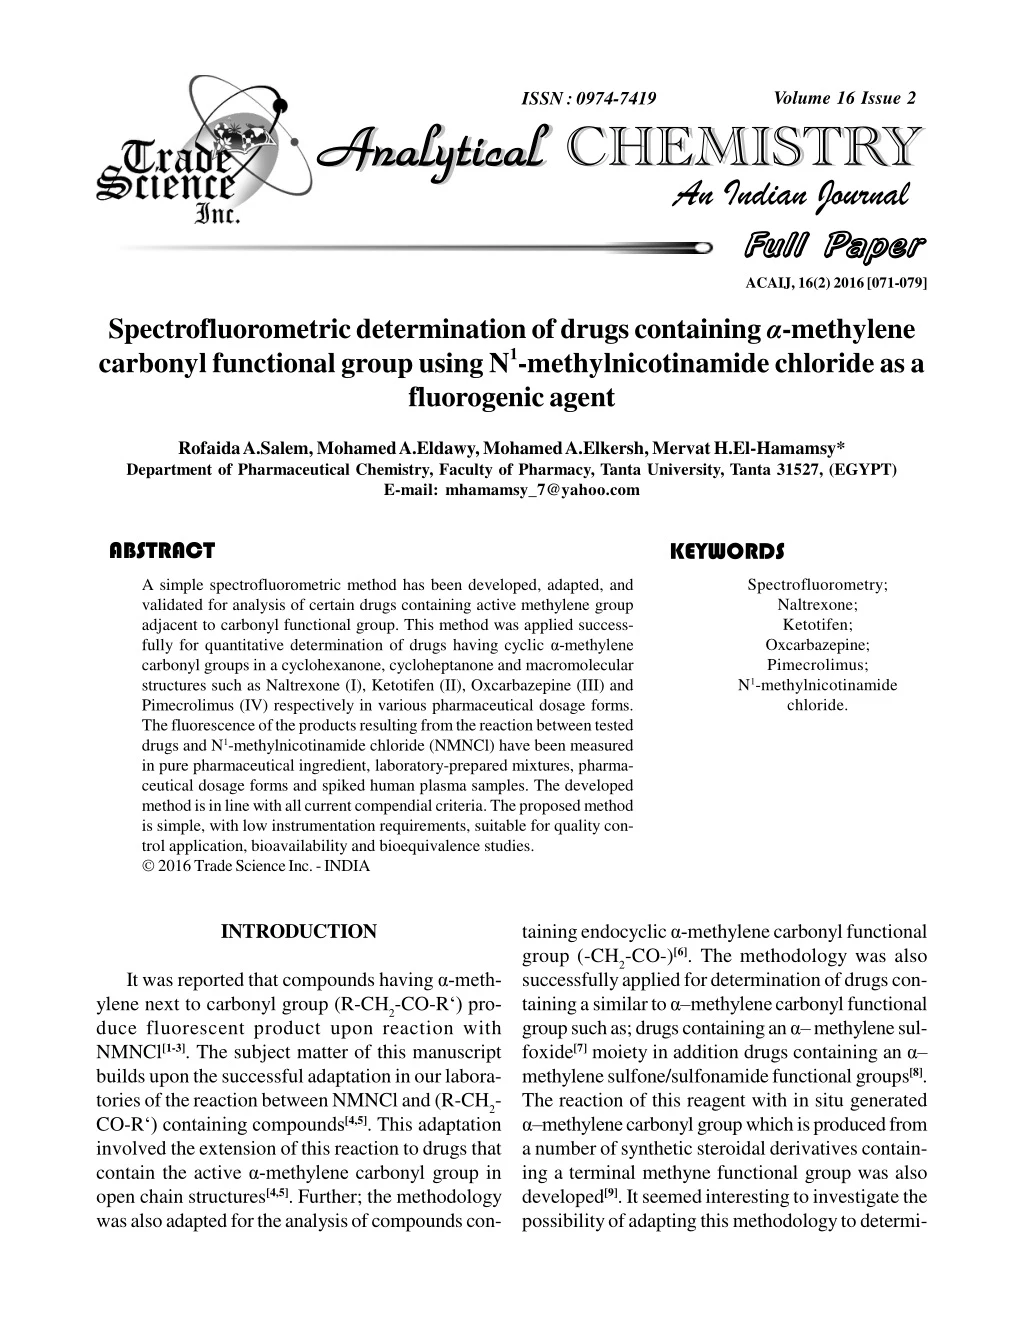
id8071625 pdfMachine by Broadgun Software - a great PDF writer! - a great PDF creator! - http://www.pdfmachine.com http://www.broadgun.com Volume 16 Issue 2 ISSN : 0974-7419 Analytical Analytical CHEMISTRY Analytical Analytical CHEMISTRY An Indian Journal Full Paper Full Paper ACAIJ, 16(2) 2016 [071-079] Spectrofluorometric determination of drugs containing á-methylene carbonyl functional group using N1-methylnicotinamide chloride as a fluorogenic agent Rofaida A.Salem, Mohamed A.Eldawy, Mohamed A.Elkersh, Mervat H.El-Hamamsy* Department of Pharmaceutical Chemistry, Faculty of Pharmacy, Tanta University, Tanta 31527, (EGYPT) E-mail: mhamamsy_7@yahoo.com ABSTRACT KEYWORDS Spectrofluorometry; Naltrexone; Ketotifen; Oxcarbazepine; Pimecrolimus; N1-methylnicotinamide chloride. A simple spectrofluorometric method has been developed, adapted, and validated for analysis of certain drugs containing active methylene group adjacent to carbonyl functional group. This method was applied success- fully for quantitative determination of drugs having cyclic á-methylene carbonyl groups in a cyclohexanone, cycloheptanone and macromolecular structures such as Naltrexone (I), Ketotifen (II), Oxcarbazepine (III) and Pimecrolimus (IV) respectively in various pharmaceutical dosage forms. The fluorescence of the products resulting from the reaction between tested drugs and N1-methylnicotinamide chloride (NMNCl) have been measured in pure pharmaceutical ingredient, laboratory-prepared mixtures, pharma- ceutical dosage forms and spiked human plasma samples. The developed method is in line with all current compendial criteria. The proposed method is simple, with low instrumentation requirements, suitable for quality con- trol application, bioavailability and bioequivalence studies. 2016 Trade Science Inc. - INDIA INTRODUCTION taining endocyclic á-methylene carbonyl functional group (-CH2-CO-)[6]. The methodology was also successfully applied for determination of drugs con- taining a similar to á–methylene carbonyl functional group such as; drugs containing an á– methylene sul- foxide[7] moiety in addition drugs containing an á– methylene sulfone/sulfonamide functional groups[8]. The reaction of this reagent with in situ generated á–methylene carbonyl group which is produced from a number of synthetic steroidal derivatives contain- ing a terminal methyne functional group was also developed[9]. It seemed interesting to investigate the possibility of adapting this methodology to determi- It was reported that compounds having á-meth- ylene next to carbonyl group (R-CH2-CO-R‘) pro- duce fluorescent product upon reaction with NMNCl[1-3]. The subject matter of this manuscript builds upon the successful adaptation in our labora- tories of the reaction between NMNCl and (R-CH2- CO-R‘) containing compounds[4,5]. This adaptation involved the extension of this reaction to drugs that contain the active á-methylene carbonyl group in open chain structures[4,5]. Further; the methodology was also adapted for the analysis of compounds con-
Spectrofluorometric determination of drugs containing á-methylene carbonyl . 72 ACAIJ, 16(2) 2016 Full Paper Full Paper nation of opoid antagonists containing endocyclic six membered á-methylene carbonyl group included in rigid structures such as Naltrexone (I). Naltrexone (I) was chosen to investigate the effect of rigidity on the generation of the fluorophore in view of Nakamura‘s findings that rigid compounds failed to react[3]. AThis method was applied for quantitative de- termination of drugs containing cyclic á–methylene carbonyl groups included in cycloheptanone ring structure like Ketotifen (II) and Oxcarbazepine (III). Also we investigated the practicalities of generat- ing a fluorophore for á-methylene carbonyl group in macrocyclic compound, Pimecrolimus (IV) Figure (1). Naltrexone (I) is a long-acting synthetic com- petitive narcotic antagonist at the opioid mu-recep- tor that is important in the detoxification of opiate addicts[10]. Naltrexone is available as 50 mg tablets, 380- mg extended release injection (vivitrol®)[11,12] and investigational implants[13,14].Naltrexone has been determined by using a wide variety of analytical tech- niques, including combination of chromatographic methods with electrochemical[15], mass[16,17], tandem mass[18] and amperometric[19] detection. Chemilumi- nescence[20] has also been used for the determina- tion of Naltrexone. Ketotifen (II) has antiallergic properties and a selective H1 antagonist effect. The drug is avail- able as 1mg tablets and 1mg/5ml oral solution[21]. Different chromatographic methods were reported for analysis of Ketotifen with electrochemical[22], mass[23, 24], tandem mass[25] detection. Ketotifen also determined by atomic absorption[26] and colorimet- ric methods[27]. Coulometric titration of Ketotifen fumarate is also a method reported for its determi- nation[28]. Moreover; it was determined using dif- ferential pulse polarography[29] and iontransfer voltammetry[30]. Chemiluminescence[31] has also been used for determination of Ketotifen. Oxcarbazepine (III) an antiepileptic drug avail- able as 150 mg, 300 mg and 600 mg film-coated tablets. Oxcarbazepine is also available as a 300 mg/5 ml (60 mg/ml) oral suspension. A number of chromatographic methods for the quantification of Oxcarbazepine and its main metabolites in biologi- cal fluids are already published however; some of these methods are not sufficiently sensitive and time- consuming[32]. Combinations of chromatographic methods with electrospray tandem mass[33] and mass detection in positive chemical ionization mode[34] seem to be the most important methods for determi- nation of (III). Electrochemical techniques provide an interesting alternative to the chromatographic methods such as Square Wave Adsorptive Stripping Voltammetry[35]. Pimecrolimus (IV); an immunomodulating agent used in treatment of atopic dermatitis (eczema)[36]. A new study of Pimecrolimus-Eluting (325µg) (Corio™) and dual drug Pimecrolimus and Paclitaxel eluting (162.5µg/10µg) (SymBio™) coro- nary stent systems in patients with de novo lesions of the native coronary arteries suspended in 2007[37]. Different methods have been reported for immuno- suppressant determination including several LC methods coupled with mass spectrometry or tandem mass spectrometry (MS/MS) detection[38]. Several immunological methods are developed for whole blood quantification of immunosuppressant drugs including enzyme multiplied immunoassay technique (EMIT)[39] and enzyme-linked immunosorbent assay (I) (II) (III) (IV) Figure 1 : Chemical structures of Naltrexone (I) Ketotifen (II), Oxcarbazepine (III) and Pimecrolimus (IV) Analytical Analytical CHEMISTRY Analytical Analytical CHEMISTRY An Indian Journal
ACAIJ, 16(2) 2016 Mervat H.El-Hamamsy et al. 73 Full Paper Full Paper (ELISA)[40]. Our newly developed method is simple com- pared to other reported methodologies that require elaborate, expensive instrumentation and time-con- suming sample preparation procedures in addition to the built in high sensitivity of the fluorometric technique. Pharma S.A.E.) Reagents and standard solutions Stock standard solutions of drugs Stock solution for (I) was prepared in water to contain 0.5 mg/ml while stock solutions for (II), (III) and (IV) were prepared in methanol to contain 0.1 mg/ml, 0.5 mg/ml and 0.1 mg/ml respectively. Serial standard solutions of drugs Aliquots of the stock solutions were diluted quantitatively with the same solvent to obtain serial standard solutions in concentration ranging from 2 to 50 ng/ml, 0.1 to 20 ng/ml, 0.5 to 60 µg/ml and 0.2 to 20 ng/ml of I, II, III and IV respectively. Assay solutions of drugs in synthetic mixtures Synthetic mixture containing (I) along with vari- ous excipients, additives and other non active in- gredients commonly used in pharmaceutical formu- lations were prepared. The mixture contained (50 mg) of Naltrexone, (8.89 mg) crospovidone, (5.08 mg) hydroxypropyl methylcellulose, (2.54 mg) magnesium stearate, (7.62 mg) polyethylene glycol, (7.62 mg) polysorbate 80, (1.27 mg) silicon dioxide, (2.54 mg) titanium diox- ide, (2.54 mg) yellow iron oxide and (2.54 mg) red iron oxide, (2.54 mg) lactose monohydrate, and mi- crocrystalline cellulose to 254 mg. Three synthetic mixture containing (II) were pre- pared. The first mixture contained (1.30 mg) of Ketotifen fumarate, (4.90 mg) magnesium stearate, (9.85 mg) ac.di.sol and avicel pH 101 to (98.50 mg). The second mixture contained (0.27 g) of Ketotifen fumarate, (0.10 g) flavor, (0.17 g) propyl paraben, (0.33 g) methyl paraben, (2.10 g) citric acid anhy- drous, (3.20 g) disodim hydrogen phosphate anhy- drous, (20 g) ethanol, (300 g) sucrose, (350 g) sor- bitol and q.s water purified to 1 liter. The third mix- ture contained (1.25 mg) Ketotifen fumarate, (0.364 g) benzalkonium chloride, (0.274 g) glycerin and purified water to complete 5 ml. One synthetic mixture containing (III) were pre- pared. The mixture contained (150 mg) of Oxcarbazepine, (3.75 mg) colloidal silicon dioxide, (22.5 mg) crospovidone, (26.25 mg) hydroxypropyl EXPERIMENTAL Apparatus. Fluorescence was detected using Shimadzu RF 5301 PC spectrofluorometer. Materials Authentic drug The working standard of (I) was supplied by Deltapharma Company. The working standard of (II) was supplied by Novartis Pharma S.A.E., Memphis Pharmaceutical and Chemical Industries Company and Pharco Pharmaceuticals (Egypt). The working standard of (III) and (IV) were supplied by Novartis Pharma S.A.E. Plasma samples were purchased from the Central Blood Bank of Tanta University Hospi- tal Chemicals N1-Methylnicotinamide chloride was purchased from Sigma Chemicals Co. Formic acid, sodium hy- droxide, methanol, and all other chemicals were of analytical grade. Water used was doubly distilled. Dosage forms Naltrexone (I): Deltrexone 50 mg tablets (Delta pharma.). Ketotifen (II): Zedotefen1mg tablets, 1 mg/5 ml syrup and 0.025% eye drops (Nasr Pharmaceutical & Chemicals Industries Company), Zaditen1mg tab- lets, 1 mg/5 ml syrup and 0.025% eye drops (Novartis Pharma S.A.E.), Zylofen1mg tablets and 1 mg/5 ml syrup (Memphis Pharmaceutical & Chemicals Industries Company) and Ketoti 1mg tab- lets and 1 mg/5 ml syrup (Pharco. Pharma-ceuticals). Oxcarbazepine (III); Trileptal 150, 300 and 600 mg tablets (Novartis Pharma S.A.E.). Pimecrolimus (IV): Elidel 1% cream (Novartis Analytical Analytical CHEMISTRY Analytical Analytical CHEMISTRY An Indian Journal
Spectrofluorometric determination of drugs containing á-methylene carbonyl . 74 ACAIJ, 16(2) 2016 Full Paper Full Paper methylcellulose, (7.5 g) magnesium stearate, (30 mg) polyethylene glycol, (7.5 mg) talc, (7.5 mg) titanium dioxide, (7.5 mg) yellow iron oxide and microcrys- talline cellulose to 750 mg. One mixture contained 1g of (IV), The mixture contained (0.1 g) of pimecrolimus (3.5 g) medium chain triglycerides, (0.5 g) oleyl alcohol, (1.5 g) propylene glycol, (0.5 g) stearyl alcohol, (0.5 g) cetyl alcohol, mono- and di-glycerides, (0.5 g) sodium cetostearyl sulphate, (0.2 g) benzyl alcohol, (0.05 g) citric acid anhydrous and purified water to 10 g. All synthetic mixtures were extracted with 100 ml methanol, filtered, and the first 10.0 ml of the filtrate was rejected. Aliquots of the filtrate were diluted with the same solvent to obtain serial dilu- tions in concentrations ranging from (3-27 ng/ml), (0.004-60 µg/ml), (5-300 µg/ml), (0.08-5 ng/ml) of Naltrexone, ketotifen, oxcarbazepine and pimecrolimus respectively. Assay solutions of drugs in their pharmaceutical preparation The mixed contents of finally powdered 20 tab- lets were accurately weighed and finely powdered. Aportion of the powder, equivalent to one tablet of naltrexone, ketotifen or oxcarbazepine was weighed and transferred with the aid of several portions of naltrexone, ketotifen and oxcarbazepine respectively. A measured volume of syrup equivalent to (1 mg) of ketotifen was transferred to 100 ml volumet- ric flask and the volume was completed with metha- nol. Aliquot of these solution were diluted with the same solvent to obtain (40 ng/ml). A measured volume of eye drops equivalent to (1 mg) ketotifen was transferred to 100 ml volumet- ric flask and the volume was completed with metha- nol. Aliquots of these solutions were diluted with the same solvent to obtain (20 ng/ml). A measured 10 gm of the cream equivalent to 100 mg pimecrolimus was transferred with the aid of several portions of chloroform to 100 ml volu- metric flask and the volume was completed with the same solvent. Aliquots of this solution were diluted with the same solvent to obtain (200 ng/ml). Assay solutions of drugs in spiked human plasma samples Serial standard solutions of the drugs Serial standard solutions were prepared in wa- ter (for I) and in methanol (for II, III and IV) to con- tain concentrations ranging from 2 to 50 ng/ml, 0.1 to 20 ng/ml, 0.5 to 60 µg/ml and 0.2 to 20 ng/ml for I, II, III and IV respectively. Preparation of spiked human plasma samples Two hundred µL of each serial standard solu- tion containing I, II, III and IV were diluted with 1800 µL human plasma and vortex mixed to obtain concentrations ranging from 1 to 30 ng/ml, 0.04 to 18 ng/ml, 1 to 55 µg/ml and 0.1 to 10 ng/ml for I, II, III and IV respectively. Preparation of assay solutions of drugs in plasma Two hundred µL of each spiked human plasma samples of I, II, III and IV were mixed with 1800 µL methanol and centrifuged for 15 minutes to separate the precipitated protein. The clear supernatant was filtered through Millipore filter ‘0.45 µm’ to obtain solutions in concentrations ranging from 0.5 to 15 ng/ml, 0.5 to 15 ng/ml, 5 to 40 µg/ml and 0.08 to 5 ng/ml for I, II, III and IV respectively. Determination of I in volunteer’s blood. Blood sample was withdrawn in a test tube to which heparin was previously added and dried. The sample was centrifuged to separate plasma and then treated as previously mentioned under preparation of assay solutions of I in plasma samples (cf. prepa- ration of assay solutions of drugs in plasma samples) N1-methylnicotinamide chloride reagent (NMNCl). 10 mM solution of NMNCl reagent was prepared by dissolving (1.7262 g) in one liter of 10-4 M HCl. Aliquots of this solution were diluted with distilled water to obtain (4.5 ³ 10-1, 4 ³ 10 -1 and 4 ³ 10 -2 mM solutions. General fluorometric procedure One ml of each drug standard solution, assay solution of synthetic mixtures, assay solution of phar- maceutical preparations, assay solution of plasma samples or the assay solution of volunteer’s plasma was transferred to 10.0 ml screw capped test tube. Analytical Analytical CHEMISTRY Analytical Analytical CHEMISTRY An Indian Journal
ACAIJ, 16(2) 2016 Mervat H.El-Hamamsy et al. 75 Full Paper Full Paper Solutions of sodium hydroxide and NMNCl were added. The mixture was cooled in ice for indicated time. The pH of the solution was adjusted using for- mic acid and heated for the indicated time (TABLE 1) finally the solution was cooled in ice for 5.0 min- utes. The mixture transferred to 10.0 ml volumetric flask and the resulting solution was adjusted to vol- ume with distilled water. Optimal concentration and volume of sodium hydroxide and NMNCl solutions, reaction pH, cooling time and heating time as well as ëex and ëem were determined as shown in (TABLE 1). The fluorimetric measurements were performed against reagent blank experiments. Concentrations of each drug were calculated from the correspond- ing regression equations. using synchronous wavelength search (TABLE 1). Different parameters analyzed are found to be affecting the reaction between the chosen drugs and NMNCl, including; (a) sodium hydroxide concen- tration and volume (b) volume and concentration of NMNCl, (c) pH values of the solution, were studied to optimize the reaction conditions to obtain a maxi- mum fluorescence intensity (Figures 2, 3, and 4). A linear relationships between the fluorescence intensities and the drug concentrations were obtained in the following ranges: 1–30 ng/ml, 0.04–15 ng/ml, 1–45 ìg/ml, and 0.08–7 ng/ml for standard solu- tions of I, II, III, and IV respectively, and over con- centration ranges of 2–25 ng/ml, 0.1–14 ng/ml, 3– 40 ìg/ml, and 0.1–8 ng/ml for spiked human plasma samples of I, II, III, and IV respectively. These re- sults revealed good and dynamic linearity ranges of the proposed method with the analyzed drugs. The good linearity of the method was indicated by the corresponding regression parameters (TABLES 2 and 3) for standard solutions and spiked human plasma samples, respectively. Validation parameters of the proposed method was studied according to the ICH topic Q2B (R1) RESULTS AND DISCUSSION When I, II, III, and IV were allowed to react with NMNCl under the optimal conditions speci- fied for each, strong fluorescent products were ob- tained. The optimal wavelengths of excitation and emission of the reaction product were determined TABLE 1 : Optimum conditions for the fluorometric procedure NaOH Conc.(mM) 5 4.2 4.5 5 NaOH Volume (ml) 1.2 1 1.2 1.2 NMNCl conc. (mM) 0.4 0.43 0.4 0.04 NMNCl volume (ml) 0.8 1.0 0.9 1.0 Cooling time (min) 10 5 7 10 Heating time (min) 10 10 12 9 Drug pH ëex(nm) ëex(nm) (I) (II) (III) (IV) 3 284 350 364 331 343 457 431 433 4.2 3 3 (a) (b) Figure 2 : Effect of NaOH concentration (a) and volume (b) on fluorescence intensity of the reaction products between Naltrexone (I) Ketotifen (II), Oxcarbazepine (III), Pimecrolimus (IV) and N1-methyl nicotinamide chlo- ride respectively Analytical Analytical CHEMISTRY Analytical Analytical CHEMISTRY An Indian Journal
Spectrofluorometric determination of drugs containing á-methylene carbonyl . 76 ACAIJ, 16(2) 2016 Full Paper Full Paper (a) (b) Figure 3 : Effect of N1-methyl nicotinamide chloride (NMNCl) concentration (a) and volume (b) on intensity of ûuorescent products resulted from the interaction between Naltrexone (I) Ketotifen (II), Oxcarbazepine (III), Pimecrolimus (IV) and N1-methyl nicotinamide chloride respectively Accuracy The accuracy of the proposed method was stud- ied by analyzing spiked human plasma samples. The results, expressed as % recovery ± S.D (TABLE 4) for spiked human plasma samples. Precision The precision of the method was judged by per- forming intraday and interday triplicate analysis of different concentrations covering the linearity range of each drug in spiked human plasma samples. The results are reported as S.D. and coefficient of varia- tion (C.V.) (TABLE 5). Specificity Figure 4 : Effect of pH on fluorescence intensity of the reaction and reaction products of Naltrexone (I) Ketotifen (II), Oxcarbazepine (III), Pimecrolimus (IV) with N1-methyl nicotinamide chloride (NMNCl) respec- tively To study the specificity of the proposed method, three synthetic mixtures of III and one synthetic mix- ture of I, IV and V were prepared to contain the pos- sible interfering substances used during pharmaceu- tical formulations. These mixtures were analyzed using the proposed method, the results, were ex- pressed as % recovery ± S.D., and were as follows: 100.35% ± 1.24 for I, 101% ± 0.04 for II, 100.2%± 0.01for III and 102.076% ± 4.56 for IV. Assay of pharmaceutical preparations including; Detection limit (DL) Detection limits were practically determined and found to be 0.6 ng/ml, 0.01 ng/ml, 0.1 ìg/ml, and 0.07 ng/ml, for standard solutions and 0.75 ng/ml, 0.03 ng/ml, 0.5 ìg/ml, and 0.09 ng/ml, for plasma samples of I, II, III, and IV respectively. Quantitation limit (QL) Quantitation limits were practically determined and found to be 1.5 ng/ml, 0.05 ng/ml, 0.3 ìg/ml, and 0.08 ng/ml, for standard solutions and 2 ng/ml, 0.1 ng/ml, 0.9 ìg/ml, and 0.1 ng/ml, for plasma samples of I, II, III, and IV respectively. All the pharmaceutical preparations available in the local market for each drug were analyzed us- ing the proposed method. The results are expressed as % recovery ± S.D (TABLE 6). Analytical Analytical CHEMISTRY Analytical Analytical CHEMISTRY An Indian Journal
ACAIJ, 16(2) 2016 Mervat H.El-Hamamsy et al. 77 Full Paper Full Paper TABLE 2 : Regression analysis parameters for the determination of I, II, III and IV in standard solutions Slope Intercept R2 Drug *Linearity range Mean 7.645 31.553 4.674 9.642 S.E 0.034 0.07638 0.043 0.340 Mean 262.21 126.35 337.36 307.4 S.E 0.875 3.912 2.650 2.987 I II III IV 1-30 ng/ml 0.04-15 ng/ml 1-45 µg/ml 0.08-5 ng/ml 0.999 0.9990 0.9990 0.999 * Average of triplicate analyses TABLE 3 : Regression analysis parameters for the determination of I, II, III and IV in spiked human plasma samples Slope Intercept R2 Drug *Linearity range Mean 5.347 24.78 3.59 47.54 S.E 0.256 0.178 0.076 1.567 Mean 268.48 111.32 277.35 321.95 S.E 1.540 1.560 0.934 2.543 I II III IV 2-25 ng/ml 0.1 -14 ng/ml 3-40 µg/ml 0.1-5.6 ng/ml 0.999 0.998 0.999 0.999 * Average of triplicate analyses TABLE 4 : Recovery data of I, II, III and IV in spiked human plasma samples Drug Claimed conc. 3ng/ml 6 13 15 21 27 1ng/ml 3 5 7 9 10.5 2 µg/ml 7 12 17 22 32 43 0.2 ng/ml 0.5 0.9 1.4 1.8 *Recovered conc. 3.02 5.97 12.99 14.97 20.97 26.95 1.055 3.058 5.056 7.039 8.988 10.536 2.534 6.946 11.927 16.690 21.969 31.806 42.904 0.2118 0.5068 0.9333 1.4001 1.7897 % Recovery 100.7% 99.47% 99.91% 99.82% 99.87% 99.82% 103% 100.23% 100.46% 100.44% 99.72% 99.52% 94.45% 97.685% 100.32% 100% 100% 99.768% 100.12% 101.8% 100.98% 100.57% 100.24% 99.92% Mean % recovery ±S.D. C.V I 100.33% ±1.612 1.607% II 103.4% ±4.949 4.786% III 98.9% ±4.0079 4.053% IV 100.7%±1.329 1.3198% * Average of triplicate analyses curacy and precision, encouraged us to study its ap- plication for monitoring the drug level in the blood of a volunteer receiving (I) therapy. The level of (I) was monitored in the blood of volunteers, and its concentration was found to be 4.5 ng/ml which lies in the therapeutic levels of I (8.6 ± 4.5 ng/ml). Determination of Naltrtexone (I) in Volunteer’s Blood The success in the application of the highly sen- sitive proposed procedure for the determination of (I) in spiked human plasma samples with good ac- Analytical Analytical CHEMISTRY Analytical Analytical CHEMISTRY An Indian Journal
Spectrofluorometric determination of drugs containing á-methylene carbonyl . 78 ACAIJ, 16(2) 2016 Full Paper Full Paper TABLE 5 : Intraday and interday precision of I, II, III and IV determination in plasma samples Drug Claimed concentration Found concentration Intra day Found concentration Inter-day C.V C.V S.D 0.04949 0.04313 0.05918 0.05664 0.05424 0.02722 0.0516 0.0592 0.0363 0.0011 0.0383 0.0109 0.1645 0.0293 0.0594 0.1025 0.1315 0.0905 0.2283 0.0092 0.0071 0.0085 0.0056 0.0049 S.D 1.3079% 1.1257% 0.4152% 0.1705% 0.1939% 0.1809% 6.097% 1.845% 0.349% 0.396% 0.373% 0.591% 0.0463% 0.0149% 0.0154% 0.0048% 0.0089% 0.0011% 0.0031% 3.49% 2.44% 0.75% 0.17% 0.46% 3 ng/ml 6 13 15 21 27 1 ng/ml 3 5 7 9 10.5 2 µg/ml 7 12 17 22 32 43 0.2 ng/ml 0.5 0.9 1.4 1.8 3.0783 ng/ml 5.9533 13.013 14.911 21.051 26.981 1.078 ng/ml 3.064 5.044 7.044 8.988 10.567 1.932 µg/ml 6.923 12.12 17.015 22.218 31.946 43.076 0.2433 ng/ml 0.5327 0.9213 1.4055 1.827 1.608% 0.725% 0.455% 0.379% 0.258% 0.101% 4.791% 1.932% 0.721% 0.016% 0.426% 0.104% 0.0851% 0.0042% 0.0049% 0.0060% 0.0059% 0.0028% 0.0053% 3.777% 1.340% 0.923% 0.398% 0.268% 3.101 5.999 12.994 14.936 21.001 26.969 1.030 3.008 5.032 7.015 8.994 10.52 1.9540 6.7915 12.218 17.024 22.100 31.927 43.224 0.2633 0.5513 0.9420 1.4124 1.8560 0.04056 0.06753 0.05395 0.02546 0.04073 0.04880 0.0629 0.0555 0.0176 0.0278 0.0335 0.0622 0.0905 0.1018 0.1874 0.0820 0.1982 0.0361 0.1327 0.00919 0.01344 0.00707 0.01655 0.00849 I II III IV TABLE 6 : Results of the recovery experiments of I, II, III and IV in different pharmaceutical preparations Drug I Pharmaceutical preparations *%Recovery ±SD 100.57% ± 1.879 102.00% ± 1.23 101.00% ± 0.26 100.85% ± 0.66 100.72%± 0.09 100.00% ± 0.54 101.382% ±1.85 101.00% ± 0.76 101.24%±1.82 99.86% ± 1.26 101.16% ± 1.59 100.20%±1.49 101.54 ± 0.54 101.00% ± 1.25 100.21%±0.036 Deltrexone 50 mg tablet Zedotefen 1 mg tablet Zaditen 1 mg tablet Zylofen 1mg tablet Ketoti 1mg tablet Zedotefen 1 mg/5ml syrup Zaditen 1 mg/5mlsyrup Zylofen 1 mg/5ml syrup ketoti 1 mg/5ml syrup Zedotefen 0.025% eye drops Zaditen 0.025% eye drops Trileptal 150 mg tablet Trileptal 300 mg tablet Trileptal 600 mg tablet Elidel 1% cream II III IV tions, spiked human plasma samples, and patient’s or volunteer’s blood. The method is simple; it gives results comparable to those obtained by other tech- niques that require elaborate instrumentation and time-consuming sample preparation procedure. The method showed good accuracy and precision suit- able for quality assurance and could be recommended for bioequivalence and bioavailability studies as CONCLUSION The proposed method makes use of the highly sensitive and specific fluorometric technique to reach low limits of detection and quantitation for the studied drugs in active pharmaceutical prepara- tion, synthetic mixtures, pharmaceutical prepara- Analytical Analytical CHEMISTRY Analytical Analytical CHEMISTRY An Indian Journal
ACAIJ, 16(2) 2016 Mervat H.El-Hamamsy et al. 79 Full Paper Full Paper [20] A.Campiglio; Analyst, 123, 1053 (1998). [21] “British Pharmacopoeia”, Her Majesty’s Stationary Office, London, 3353 (2010). [22] X.Yang, D.B.Hibbert, Biomed.Anal., 80, 85 (2008). [23] S.Tzvetanov, M.Vatsova; B.Biomed.Appl., 732, 251 (1999). [24] F.Q.Alali, B.M.Tashtoush, J.Pharm.Biomed.Anal., 34, 87 (2004). [25] X.Y.Chen, D.F.Zhong, Commun.Mass-Spectrom, 17, 2459 (2003). [26] N.M.El-Kousy, J.Pharm.Biomed.Anal., 20, 671 (1999). [27] R.T.Sane, N.L.Chonkar, S.R.Surve, M.G.Gangrad, V.V.Bapat; Indian Drugs, 30, 235 (1993). [28] W.Ciesielski, R.Zakrzewski; Pharmazie, 60, 237 (2005). [29] M.E.Mohamed, H.Y.Aboul-Enein; Dev.Ind.Pharm., 12, 733 (1986). [30] R.Tsukamoto, F.Kusu; Bunseki Kagaku, 52, 865 (2003). [31] N.Fei, L.Jiuru; Anal.Chim.Acta, 592, 68 (2007). [32] “British Pharmacopoeia”, Her Majesty’s Stationary Office, London, 4505 (2010). [33] M.B.S.Maia, D.F.D.Nascimento, I.L.Martins, A.N.Cunha, F.E.D.Lima, M.O.D.Moraes, J.Pharm.Biomed.Anal., 45, 304 (2007). [34] M.Klys, S.Rojek, F.Bolechala; J.Chromatogr.B, 825, 38 (2005). [35] M.E.B.Calvo, O.D.Renedo, M.J.A.Martínez; J.Pharm.Biomed.Anal., 43, 1156 (2007). [36] M.Zollinger, F.Waldmeier, S.Hartmann, G.Zenke, A.G.Zimmerlin, U.Glaenzel, J.P.Baldeck, A.Schweitzer, S.Berthier, M.A.Grassberger; Drug Metab.Dispos., 34, 765 (2006). [37] S.Verheye, P.Agostoni, J.Dens, W.Rutsch, D.Carrie, J.Schofer, C.Lotan, C.L.Dubois, S.A.Cohen, P.J.Fitzgerald, A.J.Lansky; The Genesis Trial, (2008). [38] H.P.Gschwinda, F.Waldmeiera; Eur.J.Pharm.Sci., 33, 9 (2008). [39] D.Z.LeGatt, C.E.Shalapay; Clin.Biochem., 37, 1022 (2004). [40] A.M.Alak, S.Moy; J.Pharm.Biomed.Anal., 16, 7 (1997). well as for validation of cleaning methodology prior to line clearance of said dosage forms. P.W.Alexander; REFERENCES J.Chromatogr. [1] J.W.Huff; J.Biol.Chem., 167, 151 (1947). [2] J.W.Huff, W.A.Perlweing; J.Biol.Chem., 167, 157 (1947). [3] H.Nakamura, Z.Tamura; Anal.Chem., 50, 2047 (1978). [4] R.A.El Barbary, M.M.Mabrouk, M.A.Eldawy; J.A.O.A.C.Int., 88, 455 (2005). [5] M.A.Eldawy, M.M.Mabrouk, R.A.El Barbary; Chem Pharm Bull, 54, 1026 (2006). [6] K.M.Elokely, M.A.Eldawy, M.A.Elkersh, T.F.Elmoselhy; Curr.Chem.Res., 2, 60 (2012). [7] K.M.Elokely, M.A.Eldawy, M.A.Elkersh, T.F.Elmoselhy; ISRN Anal.Chem., 13, 281929 (2012). [8] K.M.Elokely, M.A.Eldawy, M.A.Elkersh, T.F.Elmoselhy; Int.J.Anal.Chem., 2011, 840178 (2011). [9] K.M.Elokely, M.A.Eldawy, M.A.Elkersh, T.F.Elmoselhy; Anal.Chem.An Indian Journal, 12, 352 (2013). [10] “British Pharmacopoeia” 4119 (2010), Her Majesty’s Stationary Office, London. [11] R.Z.Turncliff, J.L.Dunar, B.L.Silverman, W.E.Elliot, C.D.Stacy, C.L.Kenneth; J.Clin.Pharmacol., 45, 1259 (2005). [12] Vivitrol prescribing information; Alkermes, Inc.; Ac- cessed on September 28.2014 at<http:// www.vivitrol.com/Content/pdf/prescribing_info.pdf [13] D.E.Arnold-Reed, R.C.Hansson; Progess in Neuro- Psychopharmacology and Biological Psychiatry, 32, 23 (2008). [14] G.O’Neil, W.Smit; J.Controll.Release, 108, 43 (2005). [15] H.Derendorf, A.El-Din, A.El-Koussi, E.R.Garrett; J.Pharm.Sci., 73, 621 (1984). [16] C.F.Chan, G.M.Chiswell, J.Chromatogr.B, 761, 85 (2001). [17] S.Valiveti, B.N.Nalluri, D.C.Hammell, K.S.Paudel, A.L.Stinchcomb; J.Chromatogr.B, 810, 259 (2004). [18] W.Naidong, H.Bu, Y.L.Chen, W.Z.Shou, X.Jiang, T.D.J.Hall; J.Pharm.Biomed.Anal, 28, 1115 (2002). [19] K.P.Kok, N.Billa, H.Y.Kah; J.Chromatogr.B, 701, 140 (1997). N.M.Najib; D.Liu; Rapid L,I.Bebawy; Drug F.A.F.Bezerra, M.E.D.Moraes; D.Qunming, T.Moenius, R.Bencini; Analytical Analytical CHEMISTRY Analytical Analytical CHEMISTRY An Indian Journal