Download
1 / 33
340 likes | 449 Views
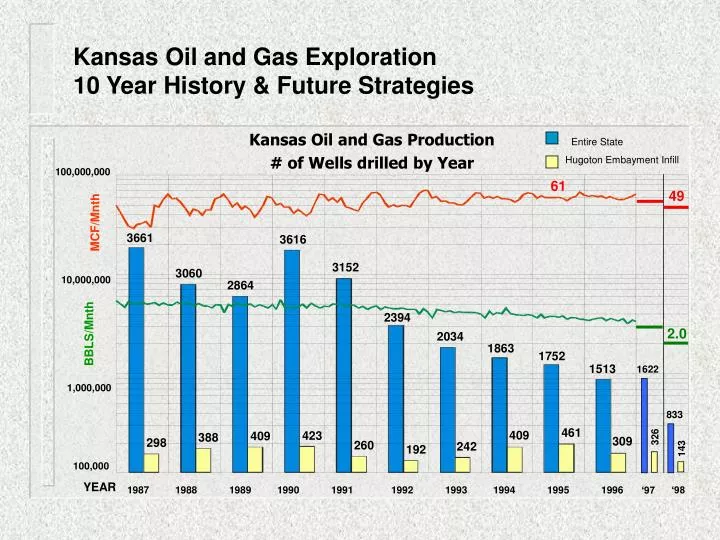
Kansas Oil and Gas Exploration 10 Year History & Future Strategies. Kansas Oil and Gas Production # of Wells drilled by Year. Entire State. Hugoton Embayment Infill. 100,000,000. 61. 49. MCF/Mnth. 3661. 3616. 3152. 3060. 10,000,000. 2864. 2394. 2.0. BBLS/Mnth. 2034. 1863. 1752.

E N D
Kansas Oil and Gas Exploration 10 Year History & Future Strategies Kansas Oil and Gas Production # of Wells drilled by Year Entire State Hugoton Embayment Infill 100,000,000 61 49 MCF/Mnth 3661 3616 3152 3060 10,000,000 2864 2394 2.0 BBLS/Mnth 2034 1863 1752 1513 1622 1,000,000 833 461 409 423 409 388 326 309 298 260 242 192 143 100,000 YEAR 1987 1988 1989 1990 1991 1992 1993 1994 1995 1996 ‘98 ‘97
Kansas Oil and Gas Exploration - 10 Year History & Future StrategiesExploration Activity 1987 to 1996 Well Completions by County (All Wells) Hugoton Embayment Eastern Kansas WC & SC Kansas
Kansas Oil and Gas Exploration - 10 Year History & Future StrategiesExploration Activity EUR NEB (Millions) by County 1987 to 1996 Well Completions 122 MM bbls oil 1,381 bcf - Hugoton Infill 856 bcf - all others NEB Conversion: 6 mcf = 1 bbl 2.2 tcf gas Eastern Kansas 3.1% of NEB WC & SC Kansas 9.7% of NEB Hugoton Embayment 83.0% of NEB 89% Gas 50% Oil
Kansas Oil and Gas Exploration - 10 Year History & Future StrategiesExploration Activity
Total EUR: 1,381 bcf Kansas Oil and Gas Exploration - 10 Year History & Future StrategiesExploration Activity EUR Gas (BCF) by County 1987 to 1996 HPBG Infill Well Completions EUR = Current Cumulative + (Current Monthly * 60)
Original Wells Cum. Production 21.7 tcf Infill Wells EUR: 1,381 bcf Kansas Oil and Gas Exploration - 10 Year History & Future StrategiesExploration Activity Average Welltest Shut-in Pressure Hugoton Field
Kansas Oil and Gas Exploration - 10 Year History & Future StrategiesExploration Activity
Kansas Oil and Gas Exploration - 10 Year History & Future StrategiesExploration Activity 1987 to 1996 Well Completions by County (No HPBG Infill Wells) WC & SC Kansas Eastern Kansas Hugoton Embayment
Kansas Oil and Gas Exploration - 10 Year History & Future StrategiesExploration Activity EUR NEB (Millions) by County 1987 to 1996 O&G Well Completions (No HPBG Infill) Eastern Kansas 15.2 mmNEB WC & SC Kansas 47.7 mmNEB Hugoton Embayment 146.8 mmNEB EUR = Current Cumulative + (Current Monthly*48) / NEB Conversion: 6 mcf = 1 bbl
Kansas Oil and Gas Exploration - 10 Year History & Future StrategiesExploration Activity EUR Oil (Million BBLs) by County 1987 to 1996 Oil Well Completions (No HPBG Infill ) Eastern Kansas 7.8 mmBBL WC & SC Kansas 34.7 mmBBL Hugoton Embayment 53.6 mmBBL EUR = Current Cumulative + (Current Monthly*48)
Kansas Oil and Gas Exploration - 10 Year History & Future StrategiesExploration Activity EUR Gas (BCF) by County 1987 to 1996 Gas Well Completions (No HPBG Infill ) Eastern Kansas 43.0 BCF WC & SC Kansas 88.8 BCF Hugoton Embayment 560.0 BCF EUR = Current Cumulative + (Current Monthly*48)
Kansas Oil and Gas Exploration - 10 Year History & Future StrategiesFuture Strategies Two Major Factors Effecting Future Exploration Inter-dependence of Three Principal Variables Product Price Drilling Activity New Reserves Discovered Historical Trends of Kansas Oil & Gas Reserves … The Past is the Key to the Future ... Largest & Average, Oil & Gas Discoveries Best & Average New Discovery Proven Reserves Oil & Gas Reserve Replacement Rate # of new producing leases
Kansas Oil and Gas Exploration - 10 Year History & Future StrategiesFuture Strategies - Interdependence of Three Principal Variables Drilling Activity vs Oil Price Future Price Perception Drilling Activity not Price Dependent (many large reserve fields to discovered) 1998 833 wells
Kansas Oil and Gas Exploration - 10 Year History & Future StrategiesFuture Strategies - Interdependence of Three Principal Variables Oil Reserve Replacement vs Oil Price Reserve Replacement not Price Dependent
Kansas Oil and Gas Exploration - 10 Year History & Future StrategiesFuture Strategies - Interdependence of Three Principal Variables Oil & Gas Reserve Replacement vs Drilling Activity (excludes HPBG Infill Drilling & Reserves) Reserve Replacement not Activity or Price Dependent (many large reserve fields to discovered) Average Finding Cost State: $9.59 / NEB NW KS: $28.69 / NEB SW KS: $3.99 / NEB
Kansas Oil and Gas Exploration - 10 Year History & Future StrategiesFuture Strategies - Historical Trends of Kansas Oil & Gas Production EUR Oil for New Discoveries Largest and Typical Lease ‘87 to ‘96 Average Largest Lease 1,296,483 bbls ‘87 to ‘96 Average Typical Lease 34,296 bbls
Kansas Oil and Gas Exploration - 10 Year History & Future StrategiesFuture Strategies - Historical Trends of Kansas Oil & Gas Production EUR Gas for New Discoveries Largest and Typical Lease ‘87 to ‘96 Average Largest Lease 6,511,460 mcf ‘87 to ‘96 Average Typical Lease 471,112 mcf
Kansas Oil and Gas Exploration - 10 Year History & Future StrategiesFuture Strategies Types of Exploration Strategies WhichCompanieshave the Lowest Finding Costs ? Corporate Strategies companies with discoveries > 500 mNEB EUR (over 10 years) companies with lowest finding costs WhichCounties produce the greatest EUR per Foot Drilled ? Geographical Strategies counties ranked by EUR and Finding Cost WhichFormations yield the Largest Reserves ? Reservoir Strategies historical and recent percentage contribution
Kansas Oil and Gas Exploration - 10 Year History & Future StrategiesCorporate Strategies - Success & Failure at Three Different Budgets Total Footage ~ 1,000,000 Ft Total Footage ~ 400,000 Ft Total Footage ~ 1,700,000 Ft
Kansas Oil and Gas Exploration - 10 Year History & Future StrategiesCorporate Strategies - Large Exploration Budgets Spatial Distribution of Exploration & Production Company Total Footage Drilled ~ 1,700,00 Ft 1987 to 1996, No HPBG Infill Company New Reserves Est Drlg & Comp Cost Spatially Limited to NW KS Very Low Success Rate Narrowly Focused on LGKC Reservoir Major Oil Co EUR 27.9 mmNEB $2.41/NEB Large Independent EUR 16,6 mmNEB $3.69/NEB Lots of Wells Oil Co EUR 2.0 mmNEB $27.77/NEB
Kansas Oil and Gas Exploration - 10 Year History & Future StrategiesCorporate Strategies - Medium Exploration Budgets Spatial Distribution of Exploration & Production Company Total Footage Drilled ~ 1,000,00 Ft 1987 to 1996, No HPBG Infill Company New Reserves Est Drlg & Comp Cost Spatially Unlimited Very Low Success Rate Poorly Focused on Reservoir Major Oil Co EUR 14.2 mmNEB $2.51/NEB No Dryhole Oil Co EUR 1.2 mmNEB $28.94/NEB Spatially Limited High Completion Rate Focused on Depleted Reservoir Dryhole Oil Co EUR 1.36 mmNEB $26.02/NEB
Kansas Oil and Gas Exploration - 10 Year History & Future StrategiesCorporate Strategies - Small Exploration Budgets Spatial Distribution of Exploration & Production Company Total Footage Drilled ~ 400,000 Ft 1987 to 1996, No HPBG Infill Company New Reserves Est Drlg & Comp Cost Small Independent EUR 10.1 mmNEB $1.58/NEB Small Independent EUR 2.5 mmNEB $4.84/NEB “Arbuckle” Oil Co EUR 0.6 mmNEB $22.20/NEB Spatially Limited Focused on Single Reservoir
Kansas Oil and Gas Exploration - 10 Year History & Future StrategiesCorporate Strategies - Companies with Lowest Finding Costs Reserves Discovered Outside Hugoton Field Cost Calculation Depth Comp Dry $/Ft $/Ft >4500 $45 $30 <4500 $40 $25 <2500 $35 $20
Kansas Oil and Gas Exploration - 10 Year History & Future StrategiesGeographical Strategies
Kansas Oil and Gas Exploration - 10 Year History & Future StrategiesGeographical Strategies Kansas Counties Finding Cost (Drlg & Comp Cost / EUR NEB) 1987 to 1996, No HPBG Infill WC & SC Kansas $17.92 average Hugoton Embayment $3.79 average
Kansas Oil and Gas Exploration - 10 Year History & Future StrategiesReservoir Strategies
Kansas Oil and Gas Exploration - 10 Year History & Future StrategiesReservoir Strategies
Kansas Oil and Gas Exploration - 10 Year History & Future StrategiesReservoir Strategies
Kansas Oil and Gas Exploration - 10 Year History & Future StrategiesReservoir Strategies
Kansas Oil and Gas Exploration - 10 Year History & Future StrategiesSummary Formation Strategies Best Oil & Gas Producing Formations* Formation Total Oil Disc. Total Gas Disc. % of Discoveries w/ % of Discoveries w EUR > 83 mbo EUR > 500 mmcf Morrow 578 656 16% 32% Missisippian 1240 1091 7% 7% Lansing-Kansas City 660 232 8% 2% Marmaton 347 337 8% 3% Arbuckle 368 0 5% 0% Cherokee 304 0 5% 0% Viola 122 52 6% 4% Simpson 61 0 8% 0% Wabaunsee 49 30 6% 10% Shawnee 0 76 0% 5% Atokan 0 53 0% 6% Niobrara 0 35 0% 6% * 1987 to 1996
Kansas Oil and Gas Exploration - 10 Year History & Future StrategiesSummary Geographical Strategies Excellent Opportunities in almost All Counties 56 counties had at least 1 oildiscovery with Lease EUR > 83,000 bbls. 30 counties had at least 1 gasdiscovery with Lease EUR > 500,000 mcf. County # of Oil Disc.*County # of Gas Disc.* FINNEY 43 SEWARD 84 HASKELL 34 MORTON 81 MORTON 25 STEVENS 64 SEWARD 20 MEADE 38 STEVENS 18 STANTON 34 NESS 18 HASKELL 30 KEARNY 17 BARBER 24 STANTON 17 COMANCHE 14 WALLACE 13 RENO 5 STAFFORD 12 CLARK 5 * 1987 to 1996, > 83 mbo or 500 mmcf
Kansas Oil and Gas Exploration - 10 Year History & Future StrategiesSummary Corporate Strategies Future Exploration Programs…. Efficiently Budgeted, Spatially Limited, with Proper Reservoir Focus …will have the Lowest Finding Costs* • Operators Drilling > 50,000 ft/yr. (10 - 15 wells/yr.) Average Finding Cost $12.79/bbl Range($/bbl): $2.41 to $28.94 Need to focus on Southwest Kansas Large Operators active outside of SW Kansas ALL have Finding Cost > $10/bbl (most above $20/bbl) • Operators Drilling < 50,000 ft/yr. Average Finding Cost: $9.04/bbl Range($/bbl): $1.51 to $24.06 • Operators Drilling < 20,000 ft/yr. Average Finding Cost: $6.22/bbl Range($/bbl): $2.34 to $11.04 * unless you happen to own leases in the Hugoton Gas Field
Kansas Oil and Gas Exploration - 10 Year History & Future StrategiesFinal Slide Acknowledgements Kansas Geological Survey for support of this research Kansas Corporation Commission furnishing well completion data Kansas Department of Revenue furnishing oil and gas production data